IndiaMART Intermesh‘s share dropped after posting its results for Q3 FY24.
Despite the negative sentiment, the company announced plans to pay a 200% dividend and implemented a 1:1 stock split.
JM Financial recommends buying IndiaMART shares despite challenges.
The company’s Q3 FY24 consolidated revenue from operations was Rs. 305 crore, a 21% YoY growth.
The company’s standalone revenue reached Rs. 291 crore, with Busy Infotech’s revenue at Rs. 13 crore.
The company’s collections from customers grew to Rs. 332 crore, and deferred revenue increased to Rs. 1,270 crore.
The company’s net profit for the quarter was Rs. 82 crore, representing a margin of 24%.
JM Financial expects a c.20% revenue CAGR over FY23–26E.
IndiaMART’s value is based on DCF, with a revised TP of INR 3,150.
About IndiaMART Intermesh
- IndiaMART, the largest B2B digital marketplace in India, is transforming business-to-business interactions by integrating SMEs with speed and ease.
- The platform fosters connections between businesses, facilitating transactions, collaborations, and partnerships with efficiency.
- IndiaMART’s strategy focuses on SMEs, aiming to be a catalyst for their integration into the digital ecosystem.
- The platform’s user-friendly interface democratizes access to the digital marketplace, ensuring businesses of all sizes can participate and benefit.
- IndiaMART leverages advanced technologies and data-driven insights to amplify the reach of SMEs within the digital marketplace.
- The platform aims to be a vibrant hub for businesses, fostering a sense of community through real-time communication tools, forums, and networking opportunities.
- IndiaMART’s resilience and adaptability in the ever-evolving digital economy make it a catalyst for the transformation of SMEs, shaping the future of B2B interactions and contributing significantly to the economic empowerment of SMEs in India.
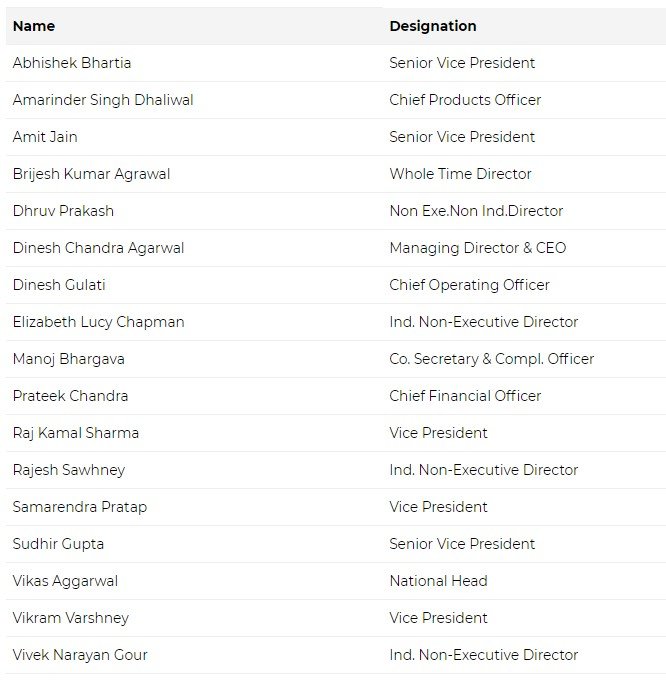
Management of IndiaMART Intermesh
Registered Address
1st Floor,
29-Daryagang,,Netaji Subash Marg,
New Delhi
Delhi
110002
Tel: 011-45608941
Fax: 011-
Email: cs@indiamart.com
Website: http://www.indiamart.com
Industry Type
Sector – Consumer Services
Sub Sector -Internet & Catalogue Retail
Classification – Smallcap
Industry Name – Miscellaneous
BSE Scrip Code -542726
NSE Scrip code – INDIAMART
ISIN –INE933S01016
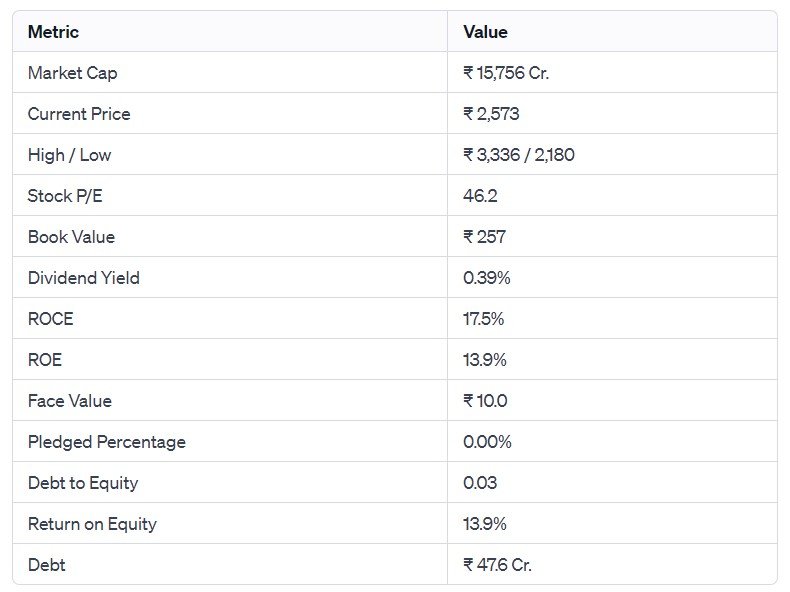
Pros & Cons of IndiaMART Intermesh

Historical Performance
| Years |
Low |
High |
| 1 Year |
2185.50 |
3335.55 |
| 3 Years |
1838.00 |
4975.00 |
| 5 Years |
551.48 |
4975.00 |
Investment Returns
| Period |
Returns |
| 1 year |
13.12% |
| 2 Years |
-19.00% |
| 3 Years |
-29.69% |
| 4 Years |
141.24% |
| 5 Years |
295.30% |
Technical Analysis of NBCC (India) Ltd
Chart
Moving Averages
| Period |
Value |
Signal |
| 5-EMA |
2595.54 |
Bullish |
| 10-EMA |
2615.72 |
Bullish |
| 20-EMA |
2646.96 |
Bearish |
| 50-EMA |
2686.76 |
Bearish |
| 100-EMA |
2733.80 |
Bearish |
| 200-EMA |
2727.61 |
Bearish |
Technical Indicators
| Indicator |
Value |
Action |
| RSI (14) |
47.91 |
Neutral |
| ATR (14) |
92.03 |
Range |
| STOCH (9,6) |
61.48 |
Neutral |
| STOCHRSI (14) |
33.33 |
Overbought |
| MACD (12,26) |
-33.23 |
Bearish |
| ADX (14) |
21.25 |
Trend |
Fundamental Analysis of IndiaMART Intermesh
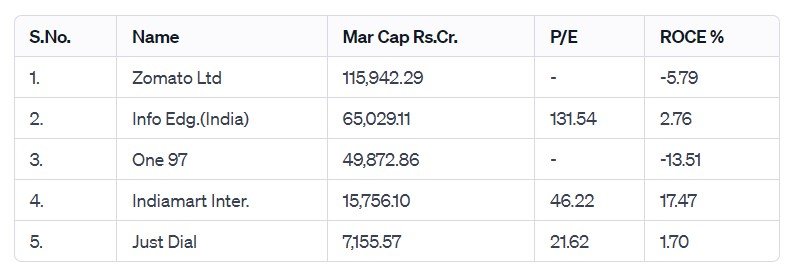
Peer Comparison
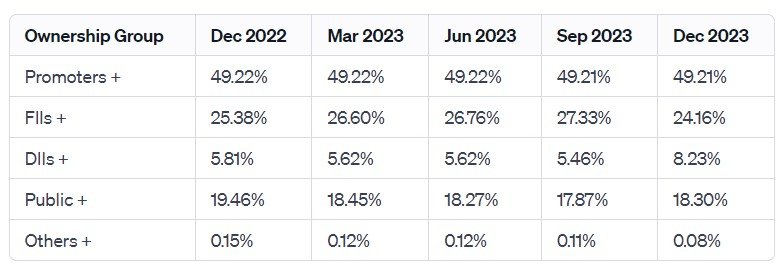
Shareholding of IndiaMART Intermesh
Last 5 Years’ Sales (In Cr.)
| March 2019 |
March 2020 |
March 2021 |
March 2022 |
March 2023 |
| 497 |
624 |
665 |
751 |
939 |
Last 5 Years’ Net Profit (In Cr.)
| March 2019 |
March 2020 |
March 2021 |
March 2022 |
March 2023 |
| 13 |
146 |
287 |
310 |
272 |
Last 5 Years’ Borrowings (In Cr.)
| March 2019 |
March 2020 |
March 2021 |
March 2022 |
March 2023 |
| 0 |
77 |
63 |
56 |
46 |
Compounded Sales Growth
| 10 Years: |
22% |
| 5 Years: |
18% |
| 3 Years: |
15% |
| TTM: |
24% |
Compounded Profit Growth
| 10 Years: |
41% |
| 5 Years: |
42% |
| 3 Years: |
22% |
| TTM: |
29% |
CAGR
| 10 Years: |
% |
| 5 Years: |
% |
| 3 Years: |
-13% |
| 1 Year: |
13% |
Return on Equity
| 10 Years: |
% |
| 5 Years: |
% |
| 3 Years: |
19% |
| Last Year: |
14% |
Cash Flow (In Cr.)
| Particulars |
Mar 2019 |
Mar 2020 |
Mar 2021 |
Mar 2022 |
Mar 2023 |
| Operating Activities |
259 |
264 |
326 |
407 |
464 |
| Investing Activities |
-282 |
-236 |
-1,343 |
-339 |
-316 |
| Financing Activities |
14 |
-51 |
1,038 |
-58 |
-143 |
| Net Cash Flow |
-9 |
-23 |
22 |
10 |
5 |
Revenue and Profit Trend
| Financial Year |
Revenue Growth |
Profit Growth |
| FY 2022-23 |
25.05% |
-12.15% |
| FY 2021-22 |
12.89% |
8.06% |
| FY 2020-21 |
6.66% |
96.1% |
| FY 2019-20 |
25.39% |
1061.03% |
| FY 2018-19 |
23.23% |
-117.38% |
Also Read –Better Than Expected: UltraTech’s Q3 Earnings Soar to ₹16,740 Cr.
Conclusion
This is a comprehensive guide to IndiaMART Intermesh. The above-mentioned data is as of January 21, 2024. These figures and projections are based on our research, analysis, company fundamentals and history, experiences, and numerous technical analyses. In addition, we have discussed in depth the share’s prospects and growth potential. Hopefully, these details will be useful in your future investments. If you’re new to our website and want to stay up-to-date on the newest stock market news, join our Telegram group. If you have any further questions, please leave them in the comments section below. We will gladly address all of your inquiries. If you enjoyed this information, please share it with as many people as possible.
Disclaimer: Dear Readers,
- We are not authorized by SEBI (Securities and Exchange Board of India).
- The information provided above is for educational purposes and should not be considered financial advice or stock recommendations.
- Share price predictions are for reference purposes and are based on positive market indicators.
- The analysis does not account for uncertainties about future or current market conditions.
- The author, brokerage firm, or Finreturns.com are not liable for losses resulting from decisions.
- Finreturns.com advises consulting with certified experts before investment decisions.


[…] Also Read –Bold Moves, Big Gains: IndiaMART’s 1:1 Split, 200% Dividend Shake Up Markets […]