- UltraTech Cement reported financial results for the third quarter ending December 2023 on Friday.
- UltraTech Cement announced consolidated profits of Rs 1775 crore, exceeding the expected amount of Rs 1739 crore.
- The company’s consolidated earnings rose to Rs 16,740 crore, exceeding the expected Rs 16,649 crore.
- The company’s EBITDA was Rs 3,254 crore, exceeding the expected Rs 3,209 crore.
- The company’s EBITDA margin increased from 15.1% to 19.4% in December 2023.
- The company’s sales volume reached 27.32 million metric tons, matching expectations.
- The company’s domestic gray cement volume increased by 5% year over year to 25.44 mt. India’s sales volume also increased by 5% annually, reaching 26.6 mt.
About UltraTech Cement Ltd
- UltraTech Cement primarily manufactures and sells cement and related products in India.
Geographical Segment Growth:
- North: Infrastructure and commercial segments showed growth; the housing segment saw growth in all regions.
- Central: Growth in housing and commercial segments; infrastructure segment faced challenges with delays.
- East: Overall growth driven by housing and rural segments; infrastructure slowed down in West Bengal and Jharkhand.
- West: Maharashtra witnessed growth in the infrastructure segment; Gujarat saw housing growth in urban and rural areas.
- South: Housing and commercial segments grew in all regions except Telangana.
Environmental, Social, and Governance (ESG) Highlights:
- Awarded Silver trophy at the India Green Manufacturing Challenge 2022 for sustainability efforts.
- Achieved ~70% of cement supply for the ~14 km Zuari Bridge, Goa.
- Ranked 6th globally in the construction material sector on S&P Global’s Dow Jones Sustainability World Index for FY22.
Global Recognition and Achievements:
- 13 limestone mines were awarded 5-star ratings.
- UltraTech’s Shared Service Center was awarded the Best Shared Services Team of the Year.
Social Initiatives and CSR:
- Reached out to ~500 villages in 16 states, benefiting more than 1.6 million beneficiaries.
- CSR spend of ₹115 crores in FY23.
Global Expansion:
- Commissioned a 2.8 MTPA greenfield grinding cement unit at Cuttack, Odisha.
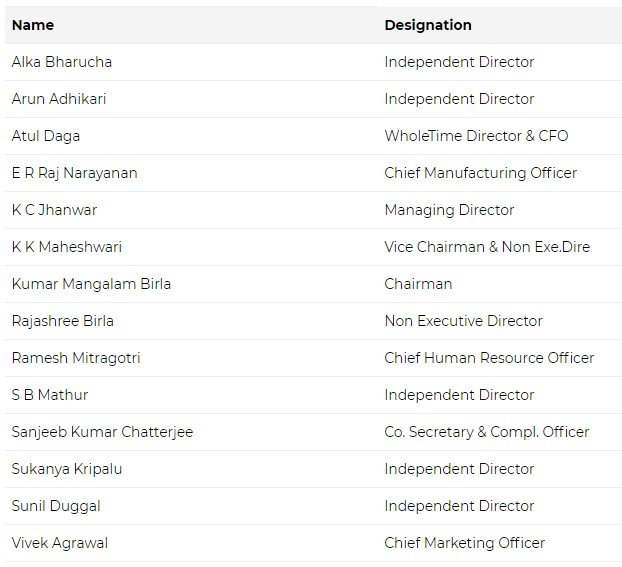
Management of UltraTech Cement Ltd
Registered Address
B’ Wing, Ahura Centre,’
2nd Foor,,Mahakali Caves Road,
Mumbai
Maharashtra
400093
Tel: 022-66917800 022-29267800
Fax: 022-66928109
Email: sharesutcl@adityabirla.com
Website: http://www.ultratechcement.com
Industry Type
Sector – Construction Materials
Sub Sector -Cements & Cement Products
Classification –Largecap
Industry Name – Cement – North India
BSE Scrip Code – 532538
NSE Scrip code – ULTRACEMCO
ISIN –INE481G01011
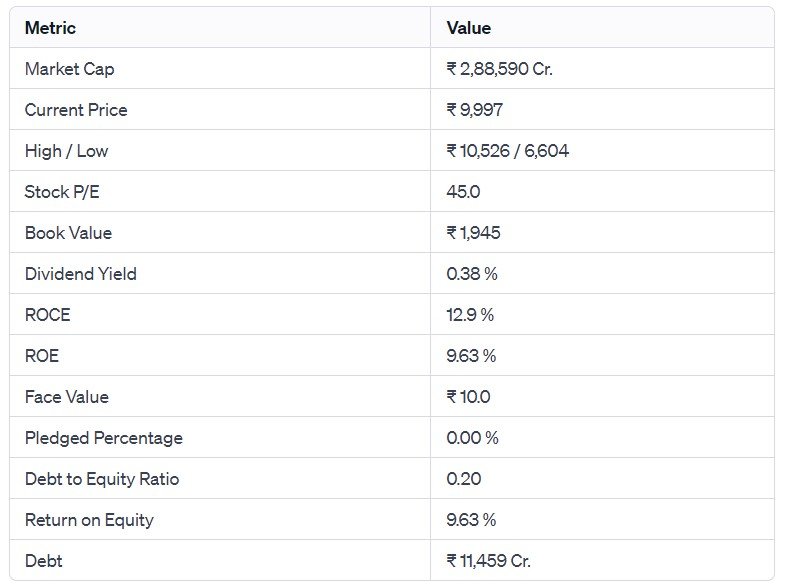
Pros & Cons of UltraTech Cement Ltd
 Historical Performance
| Years | Low | High |
| 1 Year | 6604.10 | 10526.00 |
| 3 Years | 5157.05 | 10526.00 |
| 5 Years | 2910.00 | 10526.00 |
Investment Returns
| Period | Returns |
| 1 year | 39.29% |
| 2 Years | 33.91% |
| 3 Years | 80.23% |
| 4 Years | 123.77% |
| 5 Years | 159.70% |
Technical Analysis of UltraTech Cement Ltd
Chart

Moving Averages
| Period | Value | Signal |
| 5-EMA | 9964.82 | Bullish |
| 10-EMA | 9960.79 | Bullish |
| 20-EMA | 9933.07 | Bullish |
| 50-EMA | 9594.11 | Bullish |
| 100-EMA | 9142.54 | Bullish |
| 200-EMA | 8582.45 | Bullish |
Technical Indicators
| Indicator | Value | Action |
| RSI (14) | 58.41 | Neutral |
| ATR (14) | 191.11 | Range |
| STOCH (9,6) | 48.60 | Neutral |
| STOCHRSI (14) | 43.68 | Overbought |
| MACD (12,26) | 85.23 | Bearish |
| ADX (14) | 25.51 | Trend |
Fundamental Analysis of UltraTech Cement Ltd

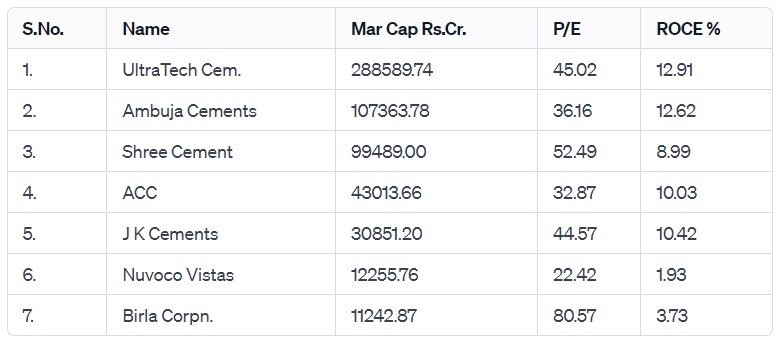
Peer Comparison

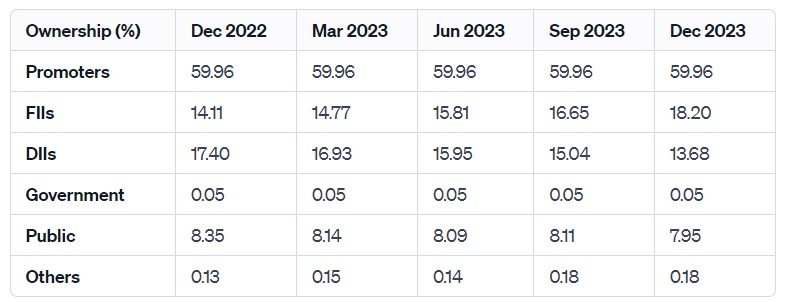
Shareholding Pattern of UltraTech Cement Ltd

Last 5 Years’ Sales (In Cr.)
| March 2019 | March 2020 | March 2021 | March 2022 | March 2023 |
| 41,462 | 42,430 | 44,726 | 52,599 | 63,240 |
Last 5 Years’ Net Profit (In Cr.)
| March 2019 | March 2020 | March 2021 | March 2022 | March 2023 |
| 2,400 | 5,751 | 5,462 | 7,334 | 5,073 |
Last 5 Years’ Borrowings
| March 2019 | March 2020 | March 2021 | March 2022 | March 2023 |
| 25,337 | 23,019 | 21,719 | 11,299 | 11,058 |
Compounded Sales Growth
| 10 Years: | 12% |
| 5 Years: | 15% |
| 3 Years: | 14% |
| TTM: | 15% |
Compounded Profit Growth
| 10 Years: | 7% |
| 5 Years: | 16% |
| 3 Years: | -4% |
| TTM: | 10% |
CAGR
| 10 Years: | 19% |
| 5 Years: | 21% |
| 3 Years: | 22% |
| 1 Year: | 39% |
Return on Equity
| 10 Years: | 12% |
| 5 Years: | 12% |
| 3 Years: | 13% |
| Last Year: | 10% |
Cash Flow (In Cr.)
| Particulars | Mar 2019 | Mar 2020 | Mar 2021 | Mar 2022 | Mar 2023 |
| Operating Activities | 5,956 | 8,972 | 12,500 | 9,283 | 9,069 |
| Investing Activities | 1,165 | -4,192 | -8,856 | 2,257 | -7,188 |
| Financing Activities | -6,757 | -5,076 | -4,356 | -12,498 | -1,631 |
| Net Cash Flow | 364 | -295 | -712 | -958 | 250 |
Revenue and Profit Trend
| Financial Year | Revenue Growth | Profit Growth |
| FY 2022-23 | 21.05% | -30.42% |
| FY 2021-22 | 17.31% | 32.28% |
| FY 2020-21 | 6.25% | -2.08% |
| FY 2019-20 | 1.63% | 126.14% |
| FY 2018-19 | 36.24% | 8.12% |
Also Read –TATA Group Shares Surge with ₹5,633 Crore Revenue, Setting a 9-Year Record
Conclusion
This is a comprehensive guide to UltraTech Cement Ltd. The above-mentioned data is as of January 20, 2024. These figures and projections are based on our research, analysis, company fundamentals and history, experiences, and numerous technical analyses. In addition, we have discussed in depth the share’s prospects and growth potential. Hopefully, these details will be useful in your future investments. If you’re new to our website and want to stay up-to-date on the newest stock market news, join our Telegram group. If you have any further questions, please leave them in the comments section below. We will gladly address all of your inquiries. If you enjoyed this information, please share it with as many people as possible.
Disclaimer: Dear Readers,
- We are not authorized by SEBI (Securities and Exchange Board of India).
- The information provided above is for educational purposes and should not be considered financial advice or stock recommendations.
- Share price predictions are for reference purposes and are based on positive market indicators.
- The analysis does not account for uncertainties about future or current market conditions.
- The author, brokerage firm, or Finreturns.com are not liable for losses resulting from decisions.
- Finreturns.com advises consulting with certified experts before investment decisions.


[…] Also Read –Better Than Expected: UltraTech’s Q3 Earnings Soar to ₹16,740 Cr. […]