The recent update of Tata Elxsi:
- Tata Elxsi’s annual net profit has increased by 6% and reached Rs 206.4 crore in the December quarter.
- The company’s operating revenue increased from Rs. 914.2 crore to Rs. 817.7 crore.
- In Q3, Q1 saw a 3% growth in net income to Rs 200.2 crore.
- In the company, Q2 and Q1 saw a 3% surge in operating revenue to Rs 881.6 crore.
- The company’s net profits saw a 77% growth to Rs 595.3 crore in March to December 2023.
- The company’s revenue from operations increased by 16% to Rs 2,734.5 crore in the December quarter.
- The transportation sector expanded by 2.7% QoQ and 15.6% YoY in the October–December quarter.
- Design Digital dominated the industrial design sector with a 12.8% QoQ increase and a 25% YoY surge.
- Tata Elxsi’s shares experienced a 2% decline, closing at Rs 8,192.
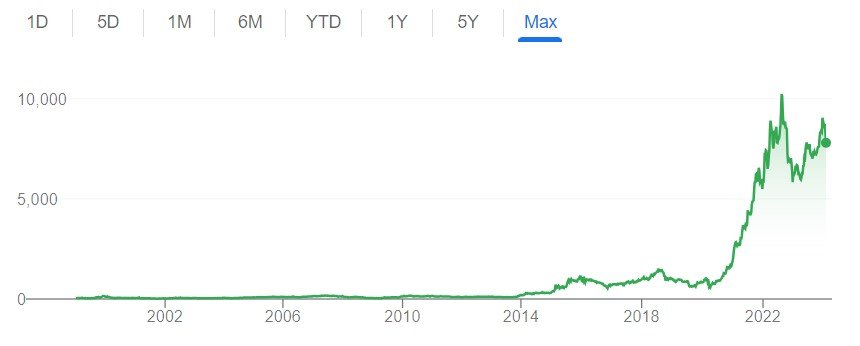
- The stock has shown robust long-term growth, with a 12.89% increase in the last six months and a 23% year-over-year gain.
About Tata Elxsi
- Tata Elxsi is a global provider of design and technology services in the automotive, media, communications, and healthcare sectors.
- The company offers integrated services including research, strategy, electronics and mechanical design, software development, validation, and deployment.
- the company’s presence in design studios, global development centers, and offices worldwide.
Key Segments:
- Embedded Product & Design (86% of Q2FY24 revenues): Provides technology consulting, new product design, development, and testing services.
- Industrial Design & Visualization (11.3% of Q2FY24 revenues): assists customers in creating innovative products, services, and experiences.
- System Integration and Support (2.7% of Q2 FY24 revenues): Integrates complete systems and solutions for specialized applications.
Revenue by industry:
- Transportation: 46.2%
- Media & Communications: 38.4%
- Healthcare and Medical Devices: 15.4%
Geographical Split:
- Europe: 40%
- Americas: 40%
- India: 15%
- Rest of the World (RoW): 5%
Onsite/Offsite Mix:
- Onsite: 26%
- Offsite: 74%
Key Deals:
- Strategic software development partner for a global automotive OEM.
- Transformation partner for video services across multiple countries.
- Multi-million-dollar deal for Level 3+ autonomous driving system development.
Partnerships:
- INVIDI Technologies: Partnership to transform addressable advertising for pay-TV operators.
- Brain Chip: Collaboration for Edge AI.
- Ateme: strategic alliance to accelerate time-to-market for content and service providers.
Management of Tata Elxsi
Registered Address
ITPB Road,
Whitefield,,
Bengaluru
Karnataka
560048
Tel: 080-22979123
Fax: 080-28411474
Email: investors@tataelxsi.com
Website: http://www.tataelxsi.com
Industry Type
Sector – Information
Sub Sector -Computers – Software & Consulting
Classification – Largecap
Industry Name – Computers – Software – Medium/Small
BSE Scrip Code – 500408
NSE Scrip code – TATAELXSI
ISIN –INE670A01012
Pros & Cons of Tata Elxsi

Historical Performance
| Years | Low | High |
| 1 Year | 5882.55 | 9200.00 |
| 3 Years | 2408.00 | 10760.00 |
| 5 Years | 499.95 | 10.760 |
Investment Returns
| Period | Returns |
| 1 year | 15.97% |
| 2 Years | 10.34% |
| 3 Years | 213.40% |
| 4 Years | 706.48% |
| 5 Years | 732.36% |
Technical Analysis of Tata Elxsi
Chart
Moving Averages
| Period | Value | Signal |
| 5-EMA | 8334.26 | Bearish |
| 10-EMA | 8447.87 | Bearish |
| 20-EMA | 8539.89 | Bearish |
| 50-EMA | 8440.80 | Bearish |
| 100-EMA | 8138.20 | Bullish |
| 200-EMA | 7771.03 | Bullish |
Technical Indicators
| Indicator | Value | Action |
| RSI (14) | 31.54 | Neutral |
| ATR (14) | 210.75 | Range |
| STOCH (9,6) | 17.71 | Oversold |
| STOCHRSI (14) | 0.00 | Oversold |
| MACD (12,26) | -70.44 | Bearish |
| ADX (14) | 21.00 | Trend |
Fundamental Analysis of Tata Elxsi
Peer Comparison
Shareholding Pattern of Tata Elxsi
Last 5 Years’ Sales (In Cr.)
| March 2019 | March 2020 | March 2021 | March 2022 | March 2023 |
| 1,597 | 1,610 | 1,826 | 2,471 | 3,145 |
Last 5 Years’ Net Profit (In Cr.)
| March 2019 | March 2020 | March 2021 | March 2022 | March 2023 |
| 290 | 256 | 368 | 550 | 755 |
Last 5 Years’ Borrowings (In Cr.)
| March 2019 | March 2020 | March 2021 | March 2022 | March 2023 |
| 0 | 58 | 73 | 138 | 185 |
Compounded Sales Growth
| 10 Years: | 18% |
| 5 Years: | 18% |
| 3 Years: | 25% |
| TTM: | 17% |
Compounded Profit Growth
| 10 Years: | 38% |
| 5 Years: | 26% |
| 3 Years: | 43% |
| TTM: | 12% |
CAGR
| 10 Years: | 46% |
| 5 Years: | 53% |
| 3 Years: | 45% |
| 1 Year: | 16% |
Return on Equity
| 10 Years: | 36% |
| 5 Years: | 35% |
| 3 Years: | 37% |
| Last Year: | 41% |
Cash Flow (In Cr.)
| Particulars | Mar 2019 | Mar 2020 | Mar 2021 | Mar 2022 | Mar 2023 |
| Operating Activities | 215 | 256 | 437 | 483 | 487 |
| Investing Activities | -162 | 43 | -439 | -106 | -201 |
| Financing Activities | -83 | -124 | -126 | -326 | -303 |
| Net Cash Flow | -30 | 175 | -128 | 51 | -17 |
Revenue and Profit Trend
| Financial Year | Revenue Growth | Profit Growth |
| FY 2022-23 | 27.28% | 37.39% |
| FY 2021-22 | 35.3% | 49.32% |
| FY 2020-21 | 13.44% | 43.74% |
| FY 2019-20 | 0.81% | -11.68% |
| FY 2018-19 | 15.19% | 20.8% |
Also Read –Pharma Powerhouse: Cipla’s 7.30% Share Jump Sparks Investor Frenzy
Conclusion
This is a comprehensive guide to Tata Elxsi. The above-mentioned data is as of January 24, 2024. These figures and projections are based on our research, analysis, company fundamentals and history, experiences, and numerous technical analyses. In addition, we have discussed in depth the share’s prospects and growth potential. Hopefully, these details will be useful in your future investments. If you’re new to our website and want to stay up-to-date on the newest stock market news, join our Telegram group. If you have any further questions, please leave them in the comments section below. We will gladly address all of your inquiries. If you enjoyed this information, please share it with as many people as possible.
Disclaimer: Dear Readers,
- We are not authorized by SEBI (Securities and Exchange Board of India).
- The information provided above is for educational purposes and should not be considered financial advice or stock recommendations.
- Share price predictions are for reference purposes and are based on positive market indicators.
- The analysis does not account for uncertainties about future or current market conditions.
- The author, brokerage firm, or Finreturns.com are not liable for losses resulting from decisions.
- Finreturns.com advises consulting with certified experts before investment decisions.


[…] Also Read –Golden Share Alert: Tata Group Stock Skyrockets—Don’t Miss the Rally! […]