
The recent update on Infibeam Avenues Limited’s share
- Infibeam Avenues has seen a significant rise in the stock market. The stock today opened at Rs 36.45 and reached a 52-week high of Rs 38.50. and the stock closed at 34.75.
- The stock has seen a 29% return in five sessions, with the one-month performance growing by over 1.5 times.
- Analysts recommend a “strong buy” recommendation for the stock, but caution is advised before making any investment decisions.
- The stock’s historical trajectory shows a remarkable climb from Rs 7.49 in October 2018 to Rs 1.56 lakh in 29 days.
- The company’s recent surge is attributed to a significant Memorandum of Understanding (MOU) with the Gujarat government, valued at ₹2,000 crore.
- Analysts advocate for a “strong buy” stance on Infibeam Avenues, citing its strong growth potential.
- The company’s strategic vision and resilience make it a promising investment opportunity.
About Infibeam Avenues Limited

- Infibeam Avenues Limited is a leading fintech company in India.
- The company was established in 2017. The company provides innovative enterprise software platforms and digital payment solutions.
- Infibeam’s BuildaBazaar, a key product, is a comprehensive suite of enterprise solutions and digital payment solutions.
- The company software supports transactions in over 27 currencies, facilitating cross-border transactions and fostering international business expansion.
- BuildaBazaar’s catalog management system and real-time price comparison feature enhance competitiveness.
- The company caters to a diverse clientele, including merchants, corporations, government agencies, and financial institutions.
- The company’s services have been provided to clients in the UAE, Saudi Arabia, Oman, and the United States.
- Infibeam Avenues is committed to delivering excellence in web development, maintenance, and e-commerce.
- The company’s commitment to delivering state-of-the-art enterprise solutions and digital payment services positions it as a key player in shaping the future of digital commerce and financial technology.
Management of Infibeam Avenues Limited
| Name | Designation |
| Ajit Mehta | Chairman Emeritus |
| Vishwas Patel | Joint Managing Director |
| Roopkishan Dave | Independent Director |
| Piyushkumar Sinha | Independent Director |
| Vishal Mehta | Chairman & Managing Director |
| Keyoor Bakshi | Independent Director |
| Vijaylaxmi Sheth | Independent Director |
Registered Address
28th Floor, GIFT Two Building,
Block No. 56, Road-5C, Zone-5,, GIFT CITY, Gandhinagar,
Gandhinagar District
Gujarat
382355
Tel: 079-67772204
Fax: 079-67772205
Email: ir@ia.ooo
Website: http://www.ia.ooo
Industry Type
Sector: Financial Services
Sub Sector: Financial Technology (Fintech)
Classification: SmallCap
Industry Name: Computers -Software – Medium / Small
BSE Scrip Code: 539807
NSE Scrip code: INFIBEAM
ISIN: INE483S01020
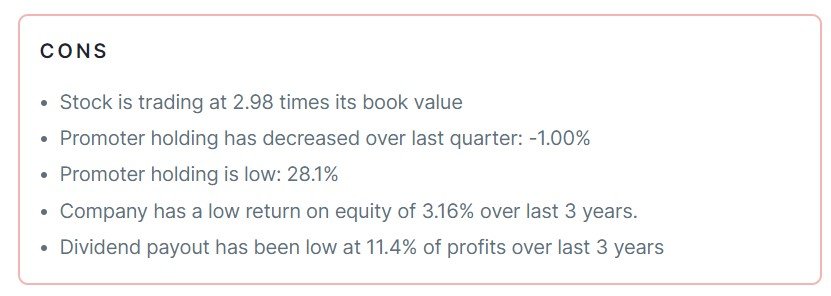
Pros & Cons of Infibeam Avenues Limited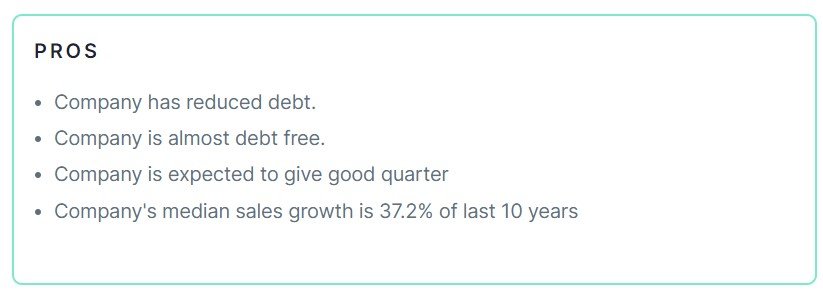
Historical Performance
| Years | Low | High |
| 1 Year | 12.85 | 38.50 |
| 3 Years | 12.50 | 38.50 |
| 5 Years | 6.60 | 38.50 |
Investment Returns
| Period | Returns |
| 1 year | 117.19% |
| 2 Years | 57.74% |
| 3 Years | 80.05% |
| 4 Years | 142.50% |
| 5 Years | 258.99% |
Dividend History of Infibeam Avenues Limited
| Announcement Date | Ex-Date | Dividend Type | Dividend (%) | Dividend (Rs) |
| 25-05-2023 | 18-09-2023 | Final | 5 | 0.05 |
| 17-01-2022 | 07-02-2022 | Interim | 5 | 0.05 |
| 27-05-2021 | 15-09-2021 | Final | 5 | 0.05 |
| 22-10-2019 | 07-11-2019 | Interim | 10 | 0.10 |
| 30-05-2018 | 19-09-2018 | Final | 10 | 0.10 |
| 06-02-2018 | 26-02-2018 | Interim | 10 | 0.10 |
Chart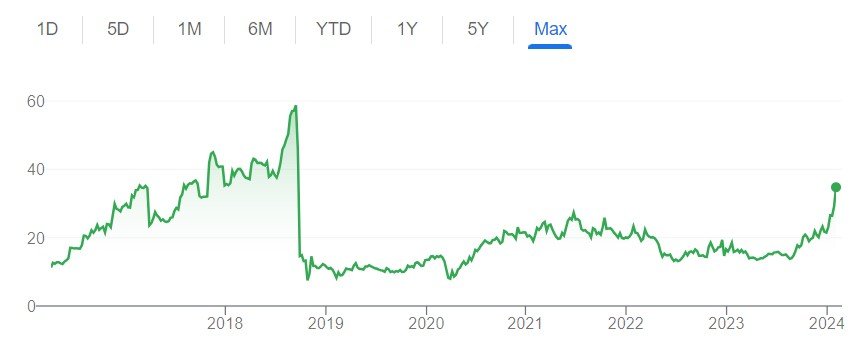
Also Read –ONGC Share Price Insight: FII’s Bold Play in Government Shares – A Year-Long Investment Guide.
Fundamental Analysis of Infibeam Avenues Limited
| Metric | Value |
| Market Cap | ₹ 9,655 Cr. |
| Current Price | ₹ 34.8 |
| High / Low | ₹ 38.6 / 12.8 |
| Stock P/E | 66.5 |
| Book Value | ₹ 11.7 |
| Dividend Yield | 0.14 % |
| ROCE | 5.53 % |
| ROE | 4.09 % |
| Face Value | ₹ 1.00 |
| Pledged Percentage | 0.00 % |
| EVEBITDA | 35.1 |
| Change in Prom Hold | -1.00 % |
| Debt to Equity | 0.00 |
| Return on Equity | 4.09 % |
| EPS | ₹ 0.55 |
| Price to Book Value | 2.98 |
| Dividend Yield | 0.14 % |
| Debt | ₹ 0.00 Cr. |
Peer Comparison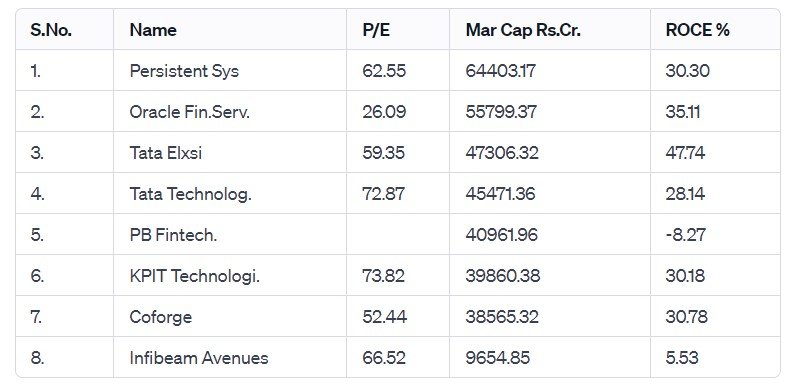
Shareholding of Infibeam Avenues Limited
Last 5 Years’ Sales (In Cr.)
| March 2019 | March 2020 | March 2021 | March 2022 | March 2023 |
| 1,159 | 633 | 676 | 1,294 | 1,962 |
Last 5 Years’ Net Profit (In Cr.)
| March 2019 | March 2020 | March 2021 | March 2022 | March 2023 |
| 126 | 108 | 70 | 84 | 136 |
Balance Sheet of Infibeam Avenues Limited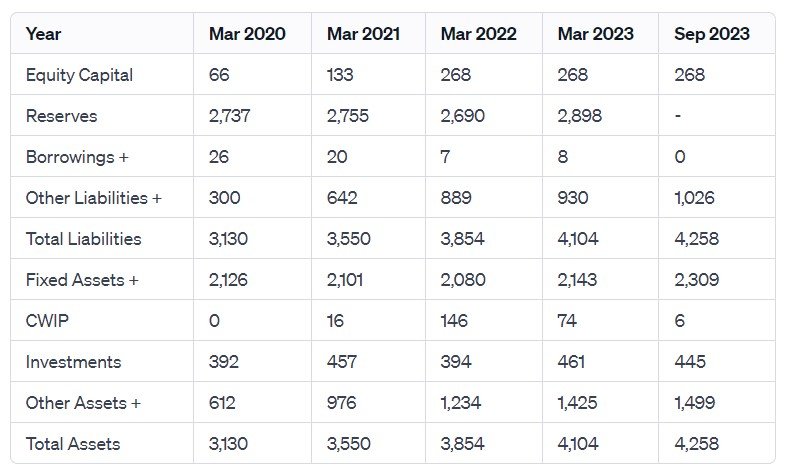
Compounded Sales Growth
| 10 Years: | 29% |
| 5 Years: | 19% |
| 3 Years: | 46% |
| TTM: | 84% |
Compounded Profit Growth
| 10 Years: | 22% |
| 5 Years: | 7% |
| 3 Years: | 7% |
| TTM: | 15% |
CAGR
| 10 Years: | % |
| 5 Years: | 30% |
| 3 Years: | 22% |
| 1 Year: | 117% |
Return on Equity
| 10 Years: | 3% |
| 5 Years: | 3% |
| 3 Years: | 3% |
| Last Year: | 4% |
Cash Flow (In Cr.)
| Particulars | Mar 2019 | Mar 2020 | Mar 2021 | Mar 2022 | Mar 2023 |
| Operating Activities | 308 | 22 | 155 | 122 | 113 |
| Investing Activities | -280 | -42 | -55 | -55 | -88 |
| Financing Activities | -54 | -26 | -9 | -36 | 37 |
| Net Cash Flow | -27 | -45 | 91 | 31 | 61 |
Revenue and Profit Trend
| Financial Year | Revenue Growth | Profit Growth |
| FY 2022-23 | 53.09% | 93.96% |
| FY 2021-22 | 102.44% | 41.41% |
| FY 2020-21 | -0.88% | 28.01% |
| FY 2019-20 | 6.83% | -0.84% |
| FY 2018-19 | 78.08% | 188.85% |
Also Read –Investment Alert: JSW Energy Share Expected to Soar, Buy Fast! Reports ₹231 Crore Profit in Q4
Conclusion
This is a comprehensive guide to Infibeam Avenues Limited’s share. The above-mentioned information and data are as of January 30, 2024. These figures and projections are based on our research, analysis, company fundamentals and history, experiences, and numerous technical analyses. In addition, we have discussed in depth the share’s prospects and growth potential. Hopefully, these details will be useful in your future investments. If you’re new to our website and want to stay up-to-date on the newest stock market news, join our Telegram group. If you have any further questions, please leave them in the comments section below. We will gladly address all of your inquiries. If you enjoyed this information, please share it with as many people as possible.
Disclaimer: Dear Readers, we are not authorized by SEBI (Securities and Exchange Board of India). The information provided above is for educational purposes and should not be considered financial advice or stock recommendations. Share price predictions are for reference purposes and are based on positive market indicators. The analysis does not account for uncertainties about future or current market conditions. The author, brokerage firm, or Finreturns.com are not liable for losses resulting from decisions. Finreturns.com advises consulting with certified experts before investment decisions.





[…] Also Read – Infibeam Avenues Share Price Rockets on Heels of ₹2000 Crore AI Deal with Government! […]
[…] Also Read –Infibeam Avenues Share Price Rockets on Heels of ₹2000 Crore AI Deal with Government! […]