The recent update on Bhansali Engineering Polymers Ltd’s Share
- Bhansali Engineering Polymers Ltd., a small-cap player in specialty chemicals, announces its third interim dividend for the fiscal year 2023–24.
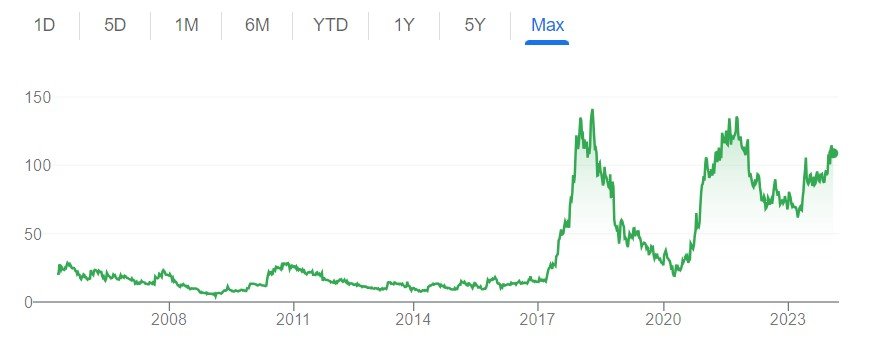
• The company’s shares have seen a 3.24% decline in the past two weeks but a 45% surge in the last year.
• The dividend, subject to tax deduction, is scheduled to be paid on or before February 14, 2024.
• The company’s stock performance has seen a 25% rally in the last three months, a 45% increase in the past year, and a 131% return over the last five years.
History of Bhansali Engineering Polymers Ltd Dividend.
| Announcement Date | Ex-Date | Dividend Type | Dividend (%) | Dividend (Rs) |
|---|---|---|---|---|
| 23-10-2023 | 02-11-2023 | Interim | 100 | 1.00 |
| 13-07-2023 | 25-07-2023 | Interim | 100 | 1.00 |
| 22-05-2023 | 09-06-2023 | Final | 100 | 1.00 |
| 23-05-2023 | 09-06-2023 | Special | 1400 | 14.00 |
| 17-10-2022 | 27-10-2022 | Interim | 100 | 1.00 |
| 18-07-2022 | 27-07-2022 | Interim | 100 | 1.00 |
| 25-04-2022 | 21-06-2022 | Final | 100 | 1.00 |
| 17-01-2022 | 27-01-2022 | Interim | 100 | 1.00 |
| 12-10-2021 | 21-10-2021 | Interim | 100 | 1.00 |
| 19-04-2021 | 22-06-2021 | Final | 100 | 1.00 |
| 16-06-2020 | 17-09-2020 | Final | 50 | 0.50 |
| 30-04-2019 | 19-09-2019 | Final | 50 | 0.50 |
| 16-04-2018 | 19-09-2018 | Final | 30 | 0.30 |
| 17-04-2017 | 06-07-2017 | Final | 20 | 0.20 |
| 30-05-2016 | 15-09-2016 | Final | 10 | 0.10 |
| 01-06-2015 | 15-09-2015 | Final | 10 | 0.10 |
| 29-05-2014 | 18-09-2014 | Final | 10 | 0.10 |
| 27-05-2013 | 12-09-2013 | Final | 10 | 0.10 |
| 29-05-2012 | 13-09-2012 | Final | 10 | 0.10 |
| 27-05-2011 | 21-09-2011 | Final | 10 | 0.10 |
| 30-06-2008 | 11-09-2008 | Final | 10 | 0.10 |
| 03-07-2007 | 13-09-2007 | Final | 10 | 0.10 |
| 27-06-2006 | 14-09-2006 | Final | 10 | 0.10 |
| 19-05-2005 | 14-07-2005 | Final | 10 | 0.10 |
About Bhansali Engineering Polymers Ltd. (BEPL)
- Bhansali Engineering Polymers Ltd. (BEPL) was established in 1984. BEPL is a leading player in the Indian polymer industry.
- The company specializes in ABS Resins, AES Resins, ASA Resins, SAN Resins, and their alloys with other plastics.
- The company contributes to various industries, including automobiles, home appliances, electronics, healthcare, and kitchenware.
- The company is famous for its commitment to quality and innovation.
- The company’s extensive product offerings include high-quality ABS, polycarbonate-ABS (PC-ABS), and specialty products.
- The company’s innovative PC-ABS blends are found in the automotive and electronic sectors.
- The company is recognized as the lowest-cost producer of ABS in India.
- The company’s strategic partnership with Nippon A&L Inc. (NAL), Japan, to expand business in Styrenics Resins.
- The company emphasizes innovation and sustainability through continuous development.
- The company has a vast customer base, including renowned companies in the automobile, home appliances, electronics, healthcare, and kitchenware sectors.
Management of Bhansali Engineering Polymers Ltd
| Name | Designation |
| M C Gupta | Chairman (Non-Executive & Ind. Director) |
| Kiran Hiralal Bhansali | Whole Time Director |
| B S Bhesania | Independent Non-Executive Director |
| Jasmine F Batliwalla | Independent Non-Executive Director |
| B M Bhansali | Managing Director |
| Jayesh B Bhansali | Executive Director & CFO |
| Dilip Kumar | Independent Non-Executive Director |
Registered Address
301 & 302, 3rd Floor, Peninsula Heights
C.D. Barfiwala Road, Andheri (West),,
Mumbai
Maharashtra
400058
Tel: 022-26216060-64
Fax: 022-26216077
Email: investors@bhansaliabs.com
Website: http://www.bhansaliabs.com
Industry Type
Sector: Chemicals
Sub Sector: Specialty Chemicals
Classification: Small Cap
Industry Name: Petrochemicals
BSE Scrip Code: 500052
NSE Scrip code: BEPL
ISIN: INE922A01025
Pros & Cons of Bhansali Engineering Polymers Ltd

Historical Performance
| Years | Low | High |
| 1 Year | 58.03 | 118.00 |
| 3 Years | 58.03 | 148.33 |
| 5 Years | 15.17 | 148.33 |
Investment Returns
| Period | Returns |
| 1 year | 45.42% |
| 2 Years | 15.01% |
| 3 Years | 16.33% |
| 4 Years | 208.00% |
| 5 Years | 131.48% |
Chart
Fundamental Analysis of Bhansali Engineering Polymers Ltd
| Metric | Value |
| Market Cap | ₹ 2,683 Cr. |
| Current Price | ₹ 108 |
| High / Low | ₹ 118 / 58.0 |
| Stock P/E | 17.6 |
| Book Value | ₹ 35.8 |
| Dividend Yield | 1.86 % |
| ROCE | 19.1 % |
| ROE | 13.3 % |
| Face Value | ₹ 1.00 |
| Pledged Percentage | 0.00 % |
| EV/EBITDA | 11.1 |
| Change in Prom Hold | 0.00 % |
| Debt to Equity | 0.00 |
| Return on Equity | 13.3 % |
| EPS | ₹ 6.13 |
| Price to Book Value | 3.01 |
| Dividend Yield | 1.86 % |
| Debt | ₹ 0.00 Cr |
Peer Comparison
| S.No. | Name | Mar Cap Rs.Cr. | P/E | ROCE % |
| 1 | Supreme Petrochem | 10679.81 | 28.49 | 37.43 |
| 2 | Styrenix Perfor. | 2723.99 | 16.87 | 29.95 |
| 3 | Bhansali Engg. | 2682.69 | 17.60 | 19.14 |
| 4 | Savita Oil Tech | 2515.26 | 15.12 | 24.24 |
| 5 | Panama Petrochem | 1946.38 | 10.04 | 34.93 |
| 6 | DCW | 1828.49 | 19.39 | 24.58 |
| 7 | Agarwal Indl. | 1531.30 | 15.77 | 23.55 |
Shareholding of Bhansali Engineering Polymers Ltd
| Category | Dec 2022 | Mar 2023 | Jun 2023 | Sep 2023 | Dec 2023 |
| Promoters + | 56.65% | 56.71% | 57.48% | 57.48% | 57.48% |
| FIIs + | 0.82% | 0.93% | 1.03% | 0.95% | 1.13% |
| DIIs + | 0.00% | 0.00% | 0.00% | 0.04% | 0.05% |
| Public + | 42.54% | 42.38% | 41.51% | 41.54% | 41.35% |
Last 5 Years’ Sales (In Cr.)
| March 2019 | March 2020 | March 2021 | March 2022 | March 2023 |
| 1,225 | 1,104 | 1,292 | 1,394 | 1,363 |
Last 5 Years’ Net Profit (In Cr.)
| March 2019 | March 2020 | March 2021 | March 2022 | March 2023 |
| 47 | 67 | 333 | 349 | 136 |
Balance Sheet of Bhansali Engineering Polymers Ltd
| Metric | March 2020 | March 2021 | March 2022 | March 2023 | Sep 2023 |
| Equity Capital | 17 | 17 | 17 | 17 | 25 |
| Reserves | 340 | 664 | 964 | 1,050 | 866 |
| Borrowings + | 0 | 0 | 0 | 0 | 0 |
| Other Liabilities + | 297 | 96 | 127 | 99 | 183 |
| Total Liabilities | 653 | 777 | 1,107 | 1,165 | 1,073 |
| Fixed Assets + | 150 | 141 | 145 | 140 | 136 |
| CWIP | 2 | 0 | 0 | 0 | 0 |
| Investments | 2 | 2 | 1 | 1 | 1 |
| Other Assets + | 500 | 634 | 962 | 1,024 | 937 |
| Total Assets | 777 | 777 | 1,107 | 1,165 | 1,073 |
Compounded Sales Growth
| 10 Years: | 13% |
| 5 Years: | 6% |
| 3 Years: | 7% |
| TTM: | -17% |
Compounded Profit Growth
| 10 Years: | 61% |
| 5 Years: | 6% |
| 3 Years: | 27% |
| TTM: | -22% |
CAGR
| 10 Years: | 28% |
| 5 Years: | 20% |
| 3 Years: | 5% |
| 1 Year: | 50% |
Return on Equity
| 10 Years: | 28% |
| 5 Years: | 31% |
| 3 Years: | 35% |
| Last Year: | 13% |
Cash Flow (In Cr.)
| Particulars | Mar 2019 | Mar 2020 | Mar 2021 | Mar 2022 | Mar 2023 |
| Operating Activities | 53 | 88 | 103 | 298 | 140 |
| Investing Activities | -55 | -43 | -21 | -300 | -15 |
| Financing Activities | -7 | -10 | -9 | -50 | -50 |
| Net Cash Flow | -8 | 35 | 74 | -52 | 75 |
Revenue and Profit Trend
| Financial Year | Revenue Growth | Profit Growth |
| FY 2022-23 | -2.25% | -61.1% |
| FY 2021-22 | 7.9% | 4.81% |
| FY 2020-21 | 16.99% | 398.94% |
| FY 2019-20 | -9.83% | 43.62% |
| FY 2018-19 | 18.72% | -53.3% |
Conclusion
This is a comprehensive guide to Bhansali Engineering Polymers Ltd’s share. The above-mentioned information and data are as of January 28, 2024. These figures and projections are based on our research, analysis, company fundamentals and history, experiences, and numerous technical analyses. In addition, we have discussed in depth the share’s prospects and growth potential. Hopefully, these details will be useful in your future investments. If you’re new to our website and want to stay up-to-date on the newest stock market news, join our Telegram group. If you have any further questions, please leave them in the comments section below. We will gladly address all of your inquiries. If you enjoyed this information, please share it with as many people as possible.
Disclaimer:
Dear Readers, we are not authorized by SEBI (Securities and Exchange Board of India). The information provided above is for educational purposes and should not be considered financial advice or stock recommendations. Share price predictions are for reference purposes and are based on positive market indicators. The analysis does not account for uncertainties about future or current market conditions. The author, brokerage firm, or Finreturns.com are not liable for losses resulting from decisions. Finreturns.com advises consulting with certified experts before investment decisions.


[…] Also Read –Is Bhansali Engineering Share Price Soar After 100% Dividend Declaration? Sets February 7 as the rec… […]