
The recent update on Olectra Greentech’s share
- Finance Minister Nirmala Sitharaman presented the budget for 2024. The budget’s announcements impacted various sectors, including electric vehicles (EVs).
- Olectra Greentech is an electric bus manufacturer. Due to budget, the share saw a significant surge in shares and reached a 52-week high of Rs 1,849.
- In the budget, the government’s emphasis on expanding the electric vehicle system and promoting charging infrastructure was a key factor in the surge.
- The government’s commitment to advancing the electric vehicle ecosystem was emphasized with the introduction of E-buses for public transport networks and the mandatory mixing of compressed biogas with CNG and piped natural gas for transportation.
- Olectra Greentech’s shares saw a jump immediately following the budget presentation; currently, the share closed at Rs 1786.65 on February 2. The share gave a return of 58.01% over the past six months.
- The company is gearing up for significant expansion, with new facilities expected to be operational in July 2024.
- The company has received over 9,000 orders for buses, with plans to deliver an additional 500 buses in the second quarter.
- The company’s financial performance is robust, with a substantial market cap of Rs 14,191.76 crore.
About Olectra Greentech Limited

- Olectra Greentech Limited is a pioneer in Indian electric mobility. The company was established in 1992. The company is the largest pure electric bus manufacturer in India.
- The company operates under the Megha Engineering & Infrastructure Limited (MEIL) group and has made significant strides in producing composite polymer insulators and electrical buses.
- Olectra Greentech is the first electric bus maker in India and has successfully deployed a range of electric vehicles, including electric buses, polymer insulation, and electric trucks.
- The company is expanding its product line to include electric mobility solutions like electric tippers and electric vehicles.
- Olectra Greentech operates in three key divisions: the Insulator division, the E-bus division, and the E-truck division.
- The company’s flagship products include power insulators and electric buses, designed for long-range operations and offering flexible seating capacities.
- The company has a strong market position with a market capitalization of ₹14,653 crore.
- The company’s operational performance includes an operating profit margin (OPM) of 14.5%, a return on capital employed (ROCE) of 13.3%, and a return on equity (ROE) of 8.11%.
- Olectra Greentech is listed on the Bombay Stock Exchange (BSE) and the National Stock Exchange (NSE) on both exchanges in India.
Management of Olectra Greentech Limited
| Name | Designation |
| K V Pradeep | Chairman & Managing Director |
| Chilappagari Laxmi Rajam | Non Exe. Non Ind. Director |
| M Gopalakrishna | Independent Director |
| Chintalapudi Laksmi Kumari | Independent Director |
| Peketi Rajesh Reddy | Non Exe. Non Ind. Director |
| Gyan Sudha Misra | Independent Director |
| B Appa Rao | Independent Director |
Registered Address
S-22, 3rd Floor,
Technocrat Industrial Estate,, Balanagar,
Hyderabad
Telangana
500037
Tel: 040-46989999
Fax: 040-
Email: info@olectra.com
Website: http://www.olectra.com
Industry Type
Sector: Automobile and Auto Components
Sub Sector: Passenger Cars & Utility Vehicles
Classification: SmallCap
Industry Name: Automobiles -LCVs / HCVs
BSE Scrip Code: 532439
NSE Scrip code: OLECTRA
ISIN: INE260D01016
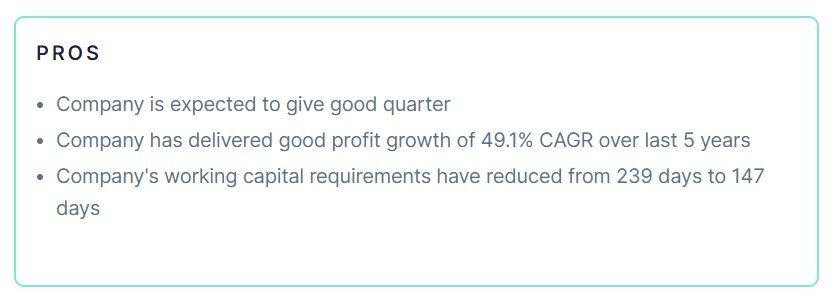
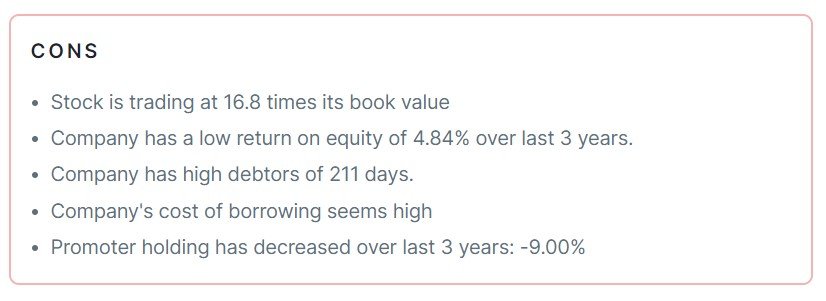
Pros & Cons of Olectra Greentech Limited
Historical Performance
| Years | Low | High |
| 1 Year | 374.10 | 1849.00 |
| 3 Years | 151.85 | 1849.00 |
| 5 Years | 41.45 | 1849.00 |
Investment Returns
| Period | Returns |
| 1 year | 279.82% |
| 2 Years | 108.16% |
| 3 Years | 1076.59% |
| 4 Years | 1017.01% |
| 5 Years | 772.81% |
Dividend History of Olectra Greentech Limited
| Announcement Date | Ex-Date | Dividend Type | Dividend (%) | Dividend (Rs) |
| 05-05-2023 | 21-09-2023 | Final | 10 | 0.40 |
| 02-05-2022 | 20-09-2022 | Final | 10 | 0.40 |
| 29-05-2012 | 20-09-2012 | Final | 5 | 0.20 |
| 30-08-2011 | 22-09-2011 | Final | 5 | 0.20 |
| 12-08-2010 | 20-09-2010 | Final | 5 | 0.20 |
| 31-08-2009 | 17-09-2009 | Final | 10 | 0.40 |
| 01-09-2008 | 18-09-2008 | Final | 10 | 0.40 |
| 30-07-2007 | 20-09-2007 | Final | 10 | 0.40 |
Chart

Fundamental Analysis of Olectra Greentech Limited
| Metric | Value |
| Market Cap | ₹ 14,653 Cr. |
| Current Price | ₹ 1,787 |
| High / Low | ₹ 1,849 / 374 |
| Stock P/E | 163 |
| Book Value | ₹ 106 |
| Dividend Yield | 0.02% |
| ROCE | 13.3% |
| ROE | 8.11% |
| Face Value | ₹ 4.00 |
| Pledged Percentage | 0.00% |
| EV/EBITDA | 75.1 |
| Change in Prom Hold | 0.00% |
| Debt to Equity | 0.15 |
| Return on Equity | 8.11% |
| EPS | ₹ 11.0 |
| Price to Book Value | 16.8 |
| Dividend Yield | 0.02% |
| Debt | ₹ 131 Cr. |
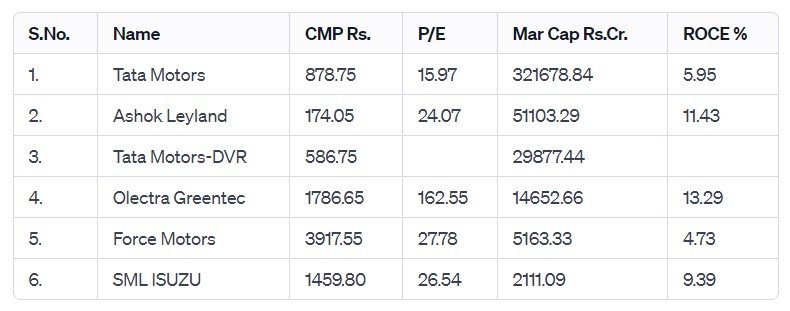
Peer Comparison
Shareholding of Olectra Greentech Limited

Last 5 Years’ Sales (In Cr.)
| March 2019 | March 2020 | March 2021 | March 2022 | March 2023 |
| 170 | 201 | 281 | 593 | 1,091 |
Last 5 Years’ Net Profit (In Cr.)
| March 2019 | March 2020 | March 2021 | March 2022 | March 2023 |
| -16 | 14 | 8 | 35 | 67 |
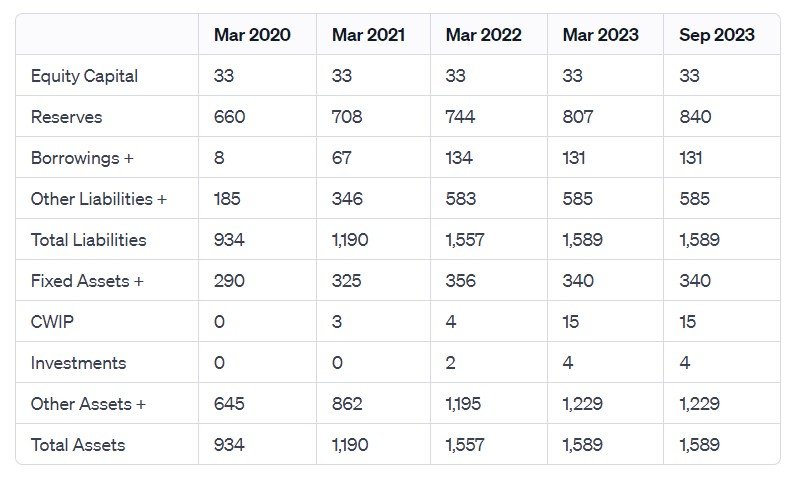
Balance Sheet of Olectra Greentech Limited
Compounded Sales Growth
| 10 Years: | 32% |
| 5 Years: | 47% |
| 3 Years: | 76% |
| TTM: | 26% |
Compounded Profit Growth
| 10 Years: | 41% |
| 5 Years: | 49% |
| 3 Years: | 200% |
| TTM: | 60% |
CAGR
| 10 Years: | 70% |
| 5 Years: | 52% |
| 3 Years: | 127% |
| 1 Year: | 280% |
Return on Equity
| 10 Years: | 3% |
| 5 Years: | 3% |
| 3 Years: | 5% |
| Last Year: | 8% |
Cash Flow (In Cr.)
| Particulars | Mar 2019 | Mar 2020 | Mar 2021 | Mar 2022 | Mar 2023 |
| Operating Activities | -130 | -219 | 209 | 121 | -10 |
| Investing Activities | -307 | 199 | -177 | -164 | -38 |
| Financing Activities | 457 | 0 | -22 | 50 | 35 |
| Net Cash Flow | 20 | -19 | 10 | 7 | -13 |
Revenue and Profit Trend
| Financial Year | Revenue Growth | Profit Growth |
| FY 2022-23 | 93.77% | 98.06% |
| FY 2021-22 | 111.18% | 192.43% |
| FY 2020-21 | -29.91% | 14.06% |
| FY 2019-20 | 36.25% | -178.84% |
| FY 2018-19 | 79.77% | -252.65% |
Also Read –Breaking Records: Tata Investment Corp Hits 52-Week High Amidst Profit Surge
Conclusion
This is a comprehensive guide to Olectra Greentech Limited. The above-mentioned information and data are as of February 2, 2024. These figures and projections are based on our research, analysis, company fundamentals and history, experiences, and numerous technical analyses. In addition, we have discussed in depth the share’s prospects and growth potential. Hopefully, these details will be useful in your future investments. If you’re new to our website and want to stay up-to-date on the newest stock market news, join our Telegram group. If you have any further questions, please leave them in the comments section below. We will gladly address all of your inquiries. If you enjoyed this information, please share it with as many people as possible.
Disclaimer: Dear Readers, we are not authorized by SEBI (Securities and Exchange Board of India). The information provided above is for educational purposes and should not be considered financial advice or stock recommendations. Share price predictions are for reference purposes and are based on positive market indicators. The analysis does not account for uncertainties about future or current market conditions. The author, brokerage firm, or Finreturns.com are not liable for losses resulting from decisions. Finreturns.com advises consulting with certified experts before investment decisions.





[…] Also Read –Olectra Greentech Share Hits All-Time High: Riding the Electric Wave Post-Budget 2024 […]