
The recent update of RattanIndia Power Limited stock
- The company declared its December result, and consolidated net loss in December increased to Rs 586.97 crore due to a decrease in revenue.
- The company’s revenue decreased from Rs 931.29 crore in the previous year to Rs 888.30 crore in October-December.
- The company’s shares increased by 2% in the morning session but dropped by 1.444% in the past five days.
- The company’s shares have shown significant gains over a longer period, with a 100% increase in the last six months and a remarkable 175% increase over the past year.
- The market capitalization of the company is Rs 5,252 crore.
About RattanIndia Power Limited
- RattanIndia Power Limited is an important player in India’s power generation sector. The company is one of the largest private power generation capacities in India.
- RattanIndia Power Limited was incorporated in 2007 as Sophia Power Company Limited, part of the Indiabulls group.
- The company was renamed Indiabulls Power Limited in 2009 and rebranded as RattanIndia Power Limited in 2014.
- The company operates two thermal power plants with a combined installed capacity of 2,700 MW in Amravati and Nashik, Maharashtra.
- The company’s presence Among the top 10 private power producers in India, it has a 2,700-MW commissioned capacity.
- The power purchase agreements of the company: Amravati Plant has had a 1,200 MW PPA with MSEDCL for 25 years.
- The company’s Fuel Security: Fuel Supply Agreements in place, enhanced fuel linkage to 6.1 MTPA.
Management of RattanIndia Power Limited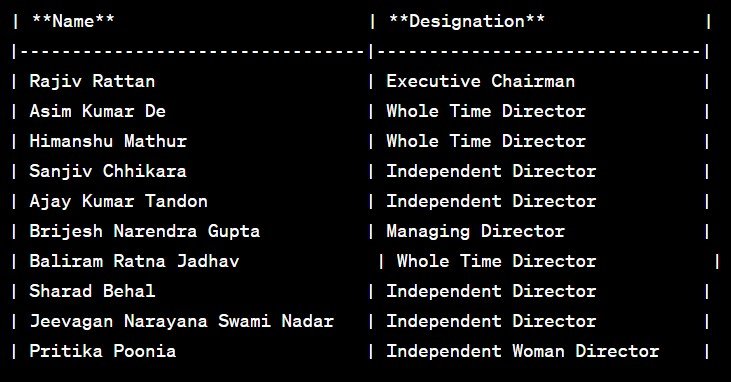
Registered Address
A-49, Ground Floor,
Road No. 4,,Mahipalpur,
New Delhi
Delhi
110037
Tel: 011-46611666
Fax: 011-46611777
Email: ir_rpl@rattanindiapower.com
Website: http://www.rattanindiapower.com
Industry Type
Sector – Power
Sub Sector -Integrated power Utilities
Classification – Smallcap
Industry Name – Power Generation and Supply
BSE Scrip Code – 533122
NSE Scrip code – RTNPOWER
ISIN –INE399K01017
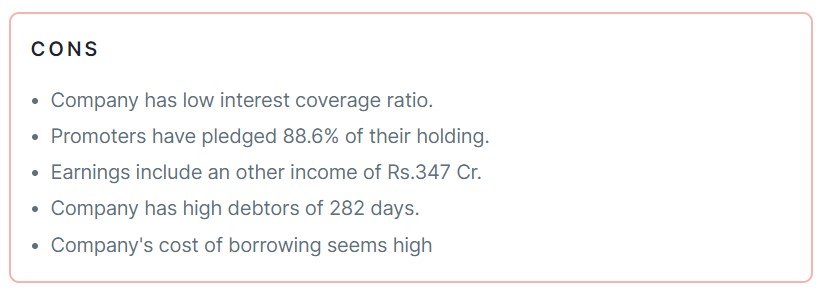
Pros & Cons of RattanIndia Power Limited
Historical Performance
| Years |
Low |
High |
| 1 Year |
2.80 |
11.70 |
| 3 Years |
2.40 |
11.70 |
| 5 Years |
0.95 |
11.70 |
Investment Returns
| Period |
Returns |
| 1 year |
172.00% |
| 2 Years |
44.68% |
| 3 Years |
223.81% |
| 4 Years |
436.84% |
| 5 Years |
183.33% |
Technical Analysis of RattanIndia Power Limited
Chart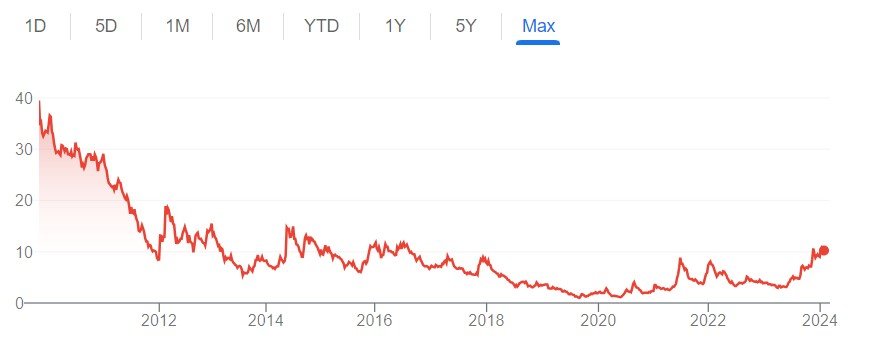
Moving Averages
| Period |
Value |
Signal |
| 5-EMA |
10.25 |
Bearish |
| 10-EMA |
10.34 |
Bearish |
| 20-EMA |
10.20 |
Bearish |
| 50-EMA |
9.54 |
Bullish |
| 100-EMA |
8.47 |
Bullish |
| 200-EMA |
7.09 |
Bullish |
Technical Indicators
| Indicator |
Value |
Action |
| RSI (14) |
50.79 |
Neutral |
| ATR (14) |
0.56 |
Range |
| STOCH (9,6) |
27.27 |
Neutral |
| STOCHRSI (14) |
9.31 |
Neutral |
| MACD (12,26) |
0.25 |
Bearish |
| ADX (14) |
27.53 |
Trend |
Fundamental Analysis of RattanIndia Power Limited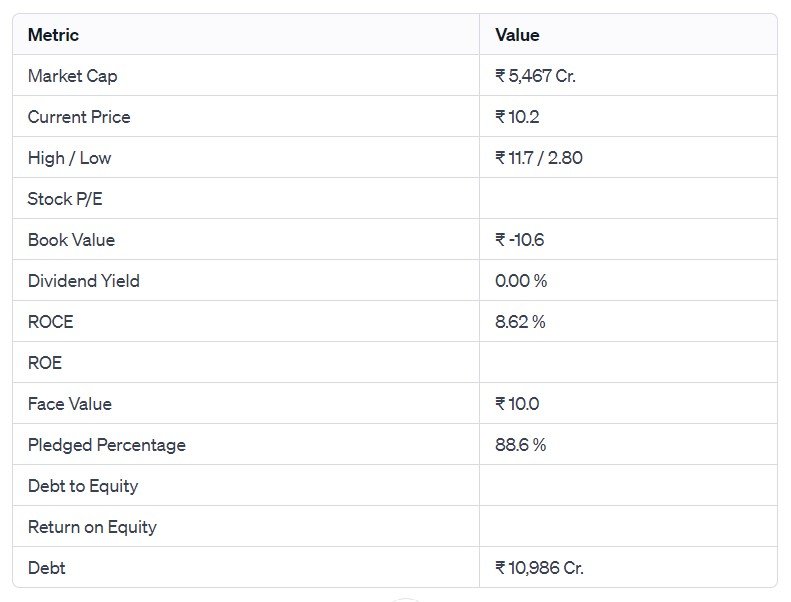
Peer Comparison
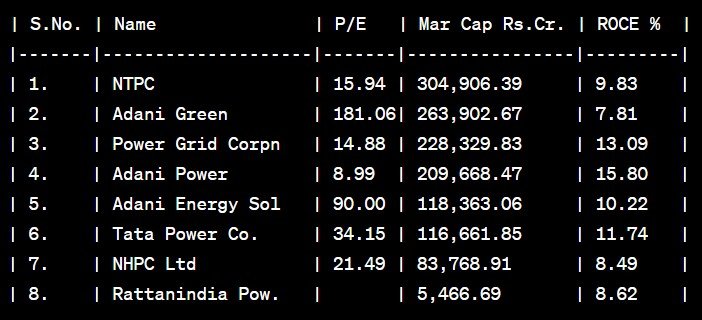
Shareholding of RattanIndia Power Limited

Last 5 Years’ Sales (In Cr.)
| March 2019 |
March 2020 |
March 2021 |
March 2022 |
March 2023 |
| 1,924 |
1,774 |
1,560 |
3,260 |
3,231 |
Last 5 Years’ Net Profit (In Cr.)
| March 2019 |
March 2020 |
March 2021 |
March 2022 |
March 2023 |
| -3,328 |
165 |
-942 |
-1,981 |
-1,870 |
Last 5 Years’ Borrowings (In Cr.)
| March 2019 |
March 2020 |
March 2021 |
March 2022 |
March 2023 |
| 13,871 |
11,932 |
11,651 |
10,967 |
10,641 |
Compounded Sales Growth
| 10 Years: |
% |
| 5 Years: |
9% |
| 3 Years: |
22% |
| TTM: |
6% |
Compounded Profit Growth
| 10 Years: |
% |
| 5 Years: |
-3% |
| 3 Years: |
8% |
| TTM: |
-33% |
CAGR
| 10 Years: |
4% |
| 5 Years: |
23% |
| 3 Years: |
48% |
| 1 Year: |
172% |
Return on Equity
| 10 Years: |
% |
| 5 Years: |
% |
| 3 Years: |
% |
| Last Year: |
% |
Cash Flow (In Cr.)
| Particulars |
Mar 2019 |
Mar 2020 |
Mar 2021 |
Mar 2022 |
Mar 2023 |
| Operating Activities |
836 |
610 |
736 |
934 |
1,015 |
| Investing Activities |
-161 |
-91 |
101 |
59 |
-5 |
| Financing Activities |
-801 |
-476 |
-795 |
-956 |
-977 |
| Net Cash Flow |
-127 |
44 |
42 |
37 |
33 |
Revenue and Profit Trend
| Financial Year |
Revenue Growth |
Profit Growth |
| FY 2022-23 |
-0.87% |
-4.45% |
| FY 2021-22 |
108.96% |
260.00% |
| FY 2020-21 |
-12.07% |
-94.91% |
| FY 2019-20 |
-7.09% |
-168.02% |
| FY 2018-19 |
-5.27% |
567.23% |
Also Read –Golden Share Alert: Tata Group Stock Skyrockets—Don’t Miss the Rally!
Conclusion
This is a comprehensive guide to RattanIndia Power Limited. The above-mentioned data is as of January 25, 2024. These figures and projections are based on our research, analysis, company fundamentals and history, experiences, and numerous technical analyses. In addition, we have discussed in depth the share’s prospects and growth potential. Hopefully, these details will be useful in your future investments. If you’re new to our website and want to stay up-to-date on the newest stock market news, join our Telegram group. If you have any further questions, please leave them in the comments section below. We will gladly address all of your inquiries. If you enjoyed this information, please share it with as many people as possible.
Disclaimer: Dear Readers,
- We are not authorized by SEBI (Securities and Exchange Board of India).
- The information provided above is for educational purposes and should not be considered financial advice or stock recommendations.
- Share price predictions are for reference purposes and are based on positive market indicators.
- The analysis does not account for uncertainties about future or current market conditions.
- The author, brokerage firm, or Finreturns.com are not liable for losses resulting from decisions.
- Finreturns.com advises consulting with certified experts before investment decisions.


[…] Also Read –Penny Stock Powerhouse: Unlocking the Potential of ₹10 Share with FII Backing […]