Cipla Ltd.’s Q3 Earnings and Shares Performance News
Cipla Ltd’s net profit increased by 32.25 percent to 1,068.41 crore during the October-December fiscal year.
The company’s shares rose 7.30 percent following the quarterly results release.
The shares started trading at Rs 1395.95, reaching a 52-week high of Rs 1412.55.
The company’s operating income rose by 13.66 percent to 6,603.81 crore during the review quarter.
The company’s total cost of operations increased by 8.78 percent to 5,119.81 crore in the December quarter.
The company’s overall earnings for the third quarter grew by 14.58 percent to 6788.44 crore.
The company’s earnings from the pharmaceutical industry were 6,365.06 crore, with the remainder coming from new ventures at 280.51 crore. The company’s Shares jumped by 35% in the Last 6 Months.
About Cipla Ltd.
- Cipla Limited is an India-based pharmaceutical company that manufactures drugs, medical chemicals, and botanical and herbal products.
- The company has two segments: pharmaceuticals and new ventures.
- The pharmaceutical segment develops, manufactures, and sells generic or branded generic medications and active pharmaceutical ingredients (API).
- The New Ventures segment runs the company, consumer health, biosimilars, and specialty businesses.
- The company’s products cover advanced generics, antibiotic drugs, anti-retroviral, respiratory, urology, and the Central Nervous System (CNS).
- The company’s marketing locations are in India, South Africa, the United States, South Africa, and the Rest of the World.
- The total operating revenue earned is 15790.60 crores, with an equity capital of 161.43 crores.
Key Points:
- Cipla is the 3rd largest pharmaceutical company in India and the 2nd largest Indian exporter in the pharma markets.
- It has a varied product portfolio of 1,500+ products in 50+ dosage forms and 65 therapeutic categories.
- The company has provided 200+ generics and complex APIs supplied to 62 countries worldwide.
- The company has a robust pipeline of over 75+ APIs across regulated markets in various stages of development.
- The company has entered into strategic partnerships for the manufacture and distribution of Molnupiravir, the investigational oral antiviral drug for the Phase 3 trial for the treatment of non-hospitalized patients with confirmed COVID-19.
- The company has entered into a joint venture agreement with ‘Kemwell Biopharma Private Limited’ for the business of developing, manufacturing, and other allied activities relating to biologic products.
- The company has five state-of-the-art R&D facilities located in New York in the US and Maharashtra and Karnataka in India.
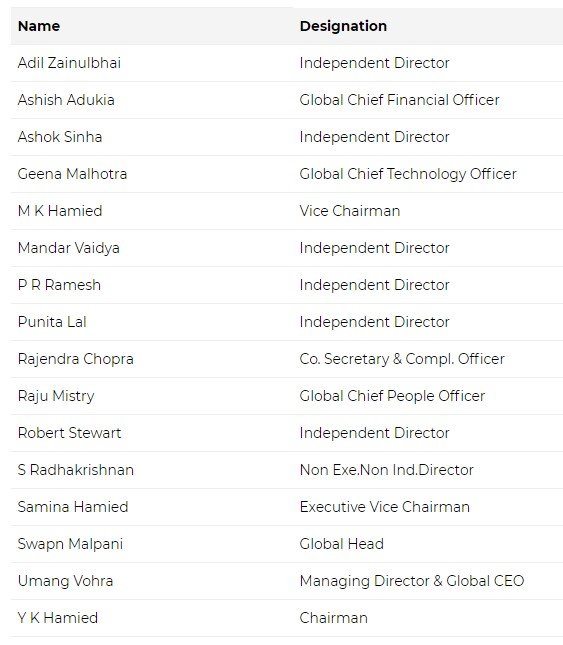
Management of Cipla Ltd.
Registered Address
Cipla House,
Peninsula Business Park,,Ganpatrao Kadam Marg,
Mumbai
Maharashtra
400013
Tel: 022-24826000
Fax: 022-24826120
Email: cosecretary@cipla.com
Website: http://www.cipla.com
Industry Type
Sector – Healthcare
Sub Sector -Pharmaceuticals
Classification – Largecap
Industry Name – Pharmaceuticals-Indian – Bulk Drugs & Formln
BSE Scrip Code – 500087
NSE Scrip code – CIPLA
ISIN –INE059A01026
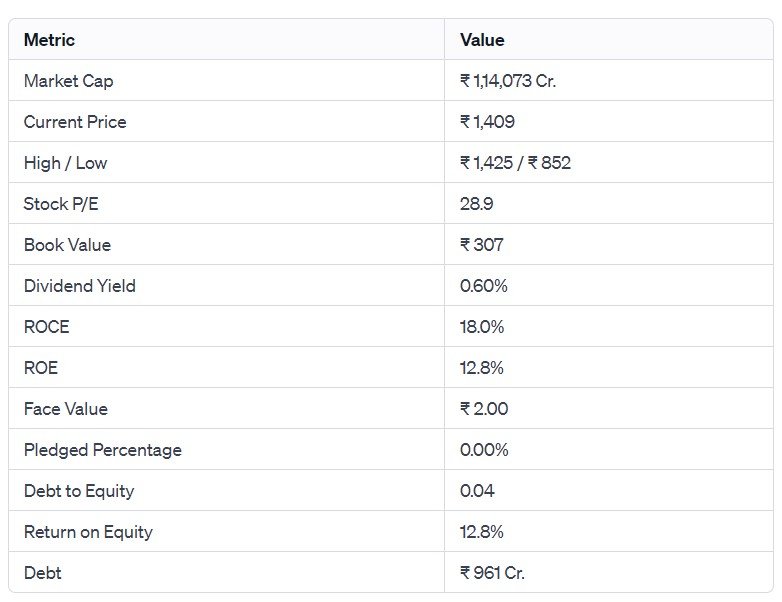
Pros & Cons of Cipla Ltd.

Historical Performance
| Years |
Low |
High |
| 1 Year |
852.00 |
1425.00 |
| 3 Years |
738.10 |
1425.00 |
| 5 Years |
355.30 |
1425.00 |
Investment Returns
| Period |
Returns |
| 1 year |
32.61% |
| 2 Years |
57.94% |
| 3 Years |
68.38% |
| 4 Years |
202.91% |
| 5 Years |
176.65% |
Technical Analysis of Cipla Ltd.
Chart
 Moving Averages
| Period |
Value |
Signal |
| 5-EMA |
1312.70 |
Bullish |
| 10-EMA |
1312.89 |
Bullish |
| 20-EMA |
1290.43 |
Bullish |
| 50-EMA |
1249.54 |
Bullish |
| 100-EMA |
1221.63 |
Bullish |
| 200-EMA |
1081.92 |
Bullish |
Technical Indicators
| Indicator |
Value |
Action |
| RSI (14) |
59.87 |
Neutral |
| ATR (14) |
26.32 |
Range |
| STOCH (9,6) |
67.82 |
Neutral |
| STOCHRSI (14) |
66.67 |
Oversold |
| MACD (12,26) |
22.45 |
Bullish |
| ADX (14) |
19.27 |
No Trend |
Fundamental Analysis of Cipla Ltd.
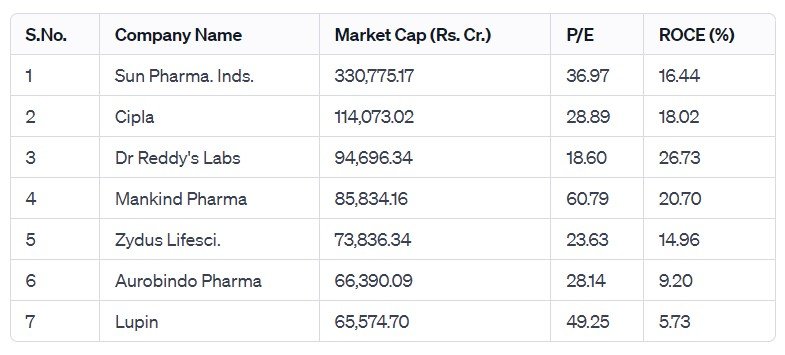
Peer Comparison
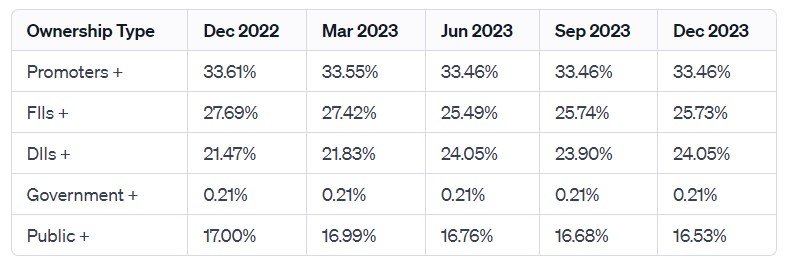
Shareholding Pattern of Cipla Ltd.
Last 5 Years’ Sales (In Cr.)
| March 2019 |
March 2020 |
March 2021 |
March 2022 |
March 2023 |
| 16,362 |
17,132 |
19,160 |
21,763 |
22,753 |
Last 5 Years’ Net Profit (In Cr.)
| March 2019 |
March 2020 |
March 2021 |
March 2022 |
March 2023 |
| 1,492 |
1,500 |
2,389 |
2,547 |
2,833 |
Last 5 Years’ Borrowings (In Cr.)
| March 2019 |
March 2020 |
March 2021 |
March 2022 |
March 2023 |
| 4,316 |
2,816 |
2,014 |
1,056 |
803 |
Compounded Sales Growth
| 10 Years: |
11% |
| 5 Years: |
8% |
| 3 Years: |
10% |
| TTM: |
14% |
Compounded Profit Growth
| 10 Years: |
6% |
| 5 Years: |
16% |
| 3 Years: |
26% |
| TTM: |
48% |
CAGR
| 10 Years: |
13% |
| 5 Years: |
23% |
| 3 Years: |
20% |
| 1 Year: |
33% |
Return on Equity
| 10 Years: |
11% |
| 5 Years: |
12% |
| 3 Years: |
13% |
| Last Year: |
13% |
Cash Flow (In Cr.)
| Particulars |
Mar 2019 |
Mar 2020 |
Mar 2021 |
Mar 2022 |
Mar 2023 |
| Operating Activities |
1,691 |
3,068 |
3,755 |
3,326 |
3,238 |
| Investing Activities |
-1,688 |
114 |
-2,374 |
-1,858 |
-2,376 |
| Financing Activities |
-349 |
-2,949 |
-1,240 |
-1,600 |
-958 |
| Net Cash Flow |
-345 |
234 |
141 |
-132 |
-97 |
Revenue and Profit Trend
| Financial Year |
Revenue Growth |
Profit Growth |
| FY 2022-23 |
2.66% |
-15.03% |
| FY 2021-22 |
36.08% |
19.84% |
| FY 2020-21 |
-10.72% |
6.48% |
| FY 2019-20 |
2.3% |
22.76% |
| FY 2018-19 |
8.64% |
28.59% |
Also Read –Game-Changer Alert: The Company Makes History with the Highest-Ever ₹32 Dividend Declaration!
Conclusion
This is a comprehensive guide to Cipla Ltd. The above-mentioned data is as of January 23, 2024. These figures and projections are based on our research, analysis, company fundamentals and history, experiences, and numerous technical analyses. In addition, we have discussed in depth the share’s prospects and growth potential. Hopefully, these details will be useful in your future investments. If you’re new to our website and want to stay up-to-date on the newest stock market news, join our Telegram group. If you have any further questions, please leave them in the comments section below. We will gladly address all of your inquiries. If you enjoyed this information, please share it with as many people as possible.
Disclaimer: Dear Readers,
- We are not authorized by SEBI (Securities and Exchange Board of India).
- The information provided above is for educational purposes and should not be considered financial advice or stock recommendations.
- Share price predictions are for reference purposes and are based on positive market indicators.
- The analysis does not account for uncertainties about future or current market conditions.
- The author, brokerage firm, or Finreturns.com are not liable for losses resulting from decisions.
- Finreturns.com advises consulting with certified experts before investment decisions.


 Moving Averages


[…] Also Read –Pharma Powerhouse: Cipla’s 7.30% Share Jump Sparks Investor Frenzy […]
[…] Also Read –Pharma Powerhouse: Cipla’s 7.30% Share Jump Sparks Investor Frenzy […]