
Performance of Tata Power Stock:
Since January 10, there has been an approximate 2.50% increase in shares.
The present market value is 343.80, which signifies a growth of 1.09%.
Brokerage Prospects:
The sentiment of brokerage institutions is optimistic.
An industry expert recommends Tata Power as a buy.
A price increase is forecast from Rs 421 to Rs 455.
The interest of investors:
The level of investor interest in Tata Power has increased.
The brokerage has increased the price forecast.
An estimated 31% increase in the value of Tata Power’s stock.
Plans for Tata Power’s Expansion:
The organization intends to increase power by 10 GW by the fourth quarter of FY27.
For expansion, an investment of 60,000 crore is required.
4.3 GW of operational solar energy, with expansion plans in place.
Agreements on Renewable Energy in Tamil Nadu:
Development Initiatives:
The development of 10,000 MW of renewable energy projects by Tata Power Renewable Energy (TPREL).
Tamil Nadu has solar, wind, and hybrid energy initiatives in the works.
The estimated capital investment is Rs 70 lakh crore.
The construction is anticipated to generate 3000 green employment.
Plant of solar cells in Gangaikondan:
A 3,800 crore investment in a 4 GW energy-efficient solar module.
Construction in the Tirunelveli district is in two phases.
Objectives: to implement 300 MW modules and cell lines utilizing TOPCon technology.
Achieve a total plant capacity of 4.3 GW.
This is a two-year mega investment plan of 800 crore in total.
About Tata Power
- Tata Power Company Ltd. is India’s largest vertically integrated power company.
- The company has a substantial energy capacity of 14,381 MW, covering thermal, wind, hydro, waste heat recovery, solar, and renewable projects.
- The company has significant projects in the pipeline, including a Pumped Hydro Project, a robust solar EPC order book, and a substantial footprint in EV charging infrastructure.
- The thermal segment led the capacity utilization at 77.2% in H1FY24.
- Operates across the entire electricity generation and distribution value chain, including thermal and renewable power generation, transmission and distribution networks, and additional services like EPC and O&M.
- Tata Power EZ Charge, the exclusive charging point operator in India, holds a dominant market share in public charging (55%) and home charger installations (85%).
- The company has a balanced portfolio with thermal, hydro, and coal contributing 32%, renewables 14%, and transmission and distribution accounting for 54%.
- The company has a strong global presence with investments in hydro projects in Georgia, Adiaristsgali, Zambia, and coal mines in Indonesia.
- The company has ambitious brownfield projects, including the Bhivpuri PSP and Shirawta PSP, and set an ambitious target of 500 GW by 2030, emphasizing green energy.
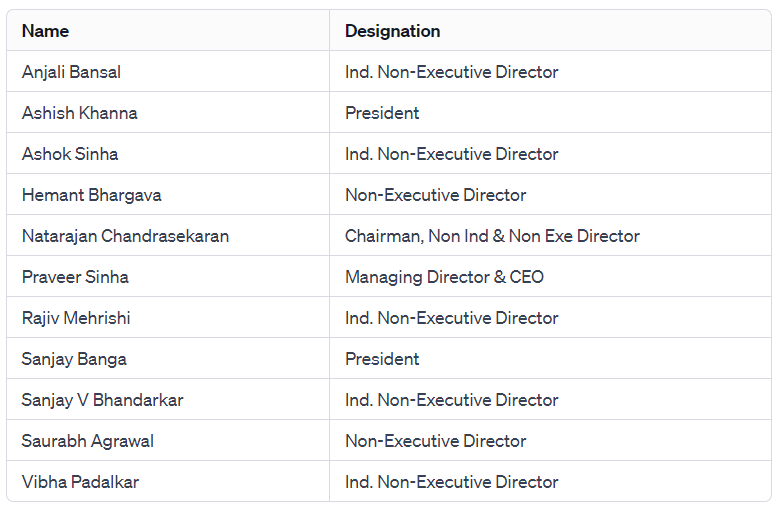
Management of Tata Power
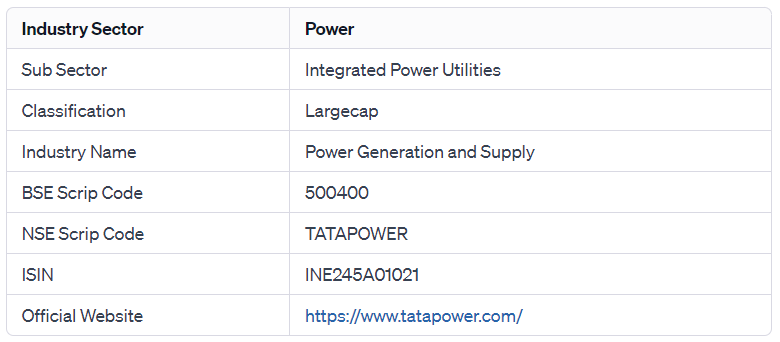
Industry Type
Pros & Cons of the Company


Historical Performance
| Years | Low | High |
| 1 Year | 182.35 | 359.90 |
| 3 Years | 74.45 | 360 |
| 5 Years | 27.00 | 360 |
Investment Returns
| Period | Returns |
| 1 year | 73.57% |
| 2 Years | 53.28% |
| 3 Years | 328.93% |
| 4 Years | 501.52% |
| 5 Years | 376.40% |
Technical Analysis of Tata Power
Chart

Moving Averages
| Period | Value | Signal |
| 5-EMA | 340.48 | Bullish |
| 10-EMA | 336.50 | Bullish |
| 20-EMA | 328.50 | Bullish |
| 50-EMA | 304.42 | Bullish |
| 100-EMA | 280.89 | Bullish |
| 200-EMA | 257.66 | Bullish |
Technical Indicators
| Indicator | Value | Action |
| RSI (14) | 71.49 | Neutral |
| ATR (14) | 9.89 | Range |
| STOCH (9,6) | 91.22 | Overbought |
| STOCHRSI (14) | 44.72 | Overbought |
| MACD (12,26) | 12.06 | Bearish |
| ADX (14) | 31.47 | Trend |
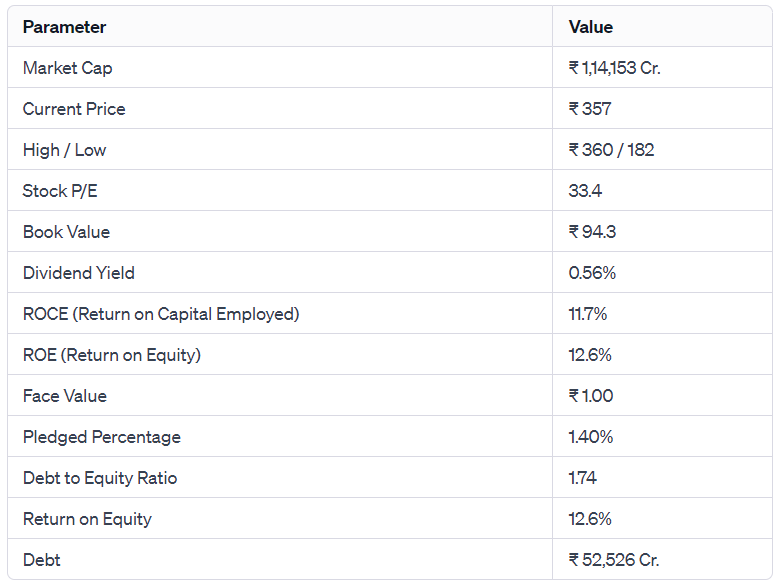
Fundamental Analysis of Tata Power
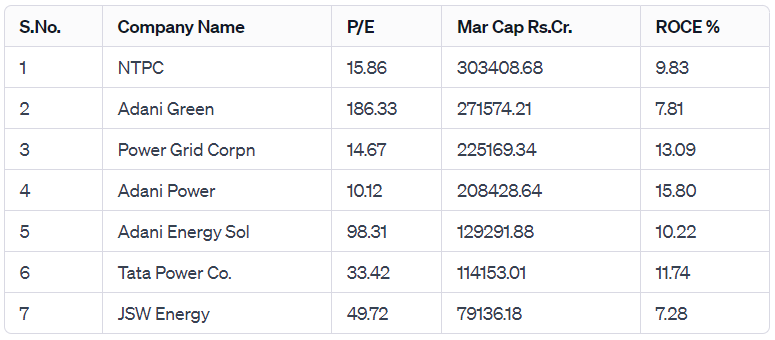
Peer Comparison
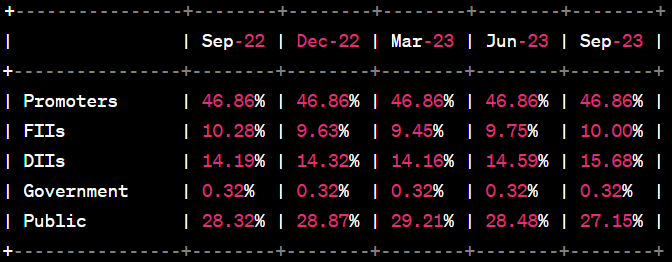
Shareholding Pattern
Last 5 Years’ Sales (In Cr.)
| March 2019 | March 2020 | March 2021 | March 2022 | March 2023 |
| 29,881 | 29,136 | 32,703 | 42,816 | 55,109 |
Last 5 Years’ Net Profit (In Cr.)
| March 2019 | March 2020 | March 2021 | March 2022 | March 2023 |
| 2,606 | 1,316 | 1,439 | 2,156 | 3,810 |
Last 5 Years’ Borrowings
| March 2019 | March 2020 | March 2021 | March 2022 | March 2023 |
| 48,506 | 51,936 | 46,708 | 51,195 | 52,923 |
Compounded Sales Growth
| 10 Years: | 5% |
| 5 Years: | 15% |
| 3 Years: | 24% |
| TTM: | 12% |
Compounded Profit Growth
| 10 Years: | 39% |
| 5 Years: | 45% |
| 3 Years: | 133% |
| TTM: | 13% |
CAGR
| 10 Years: | 17% |
| 5 Years: | 37% |
| 3 Years: | 62% |
| 1 Year: | 74% |
Return on Equity
| 10 Years: | 5% |
| 5 Years: | 7% |
| 3 Years: | 9% |
| Last Year: | 13% |
Revenue and Profit Trend
| Financial Year | Revenue Growth | Profit Growth |
| FY 2022-23 | 59.6% | 17.43% |
| FY 2021-22 | -15.65% | 848.12% |
| FY 2020-21 | 70.45% | 98.16% |
| FY 2019-20 | -6.41% | -91.63% |
| FY 2018-19 | 9.54% | -156.14% |
Conclusion
This is a comprehensive guide to Tata Power. The above-mentioned data is as of January 11,2024. These figures and projections are based on our research, analysis, company fundamentals and history, experiences, and numerous technical analyses. In addition, we have discussed in depth the share’s prospects and growth potential. Hopefully, these details will be useful in your future investments. If you’re new to our website and want to stay up-to-date on the newest stock market news, join our Telegram group. If you have any further questions, please leave them in the comments section below. We will gladly address all of your inquiries. If you enjoyed this information, please share it with as many people as possible.
Read Also- Don’t Miss Out! Grow Your Portfolio: Rs 10,000 Share Buyback Offer with 40 Lakh Shares!
Disclaimer: Dear Readers,
- We are not authorized by SEBI (Securities and Exchange Board of India).
- The information provided above is for educational purposes and should not be considered financial advice or stock recommendations.
- Share price predictions are for reference purposes and are based on positive market indicators.
- The analysis does not account for uncertainties about future or current market conditions.
- The author, brokerage firm, or Finreturns.com are not liable for losses resulting from decisions.
- Finreturns.com advises consulting with certified experts before investment decisions.


[…] Read Also – Smart Investment Choice: TATA Share Gains Buy Recommendation, Aiming for Sectoral Leadership. […]
[…] Also Read – Smart Investment Choice: TATA Share Gains Buy Recommendation, Aiming for Sectoral Leadership. […]