The recent update of Vedanta Limited/Dividend
- Vedanta Limited is a leading Indian business player. The company announced its 2023 dividend. The company has the highest dividend-paying stock in India.
- The Board of Directors approved a second interim dividend of ₹11 per equity share. It is a significant 1100% increase from the face value of ₹1.
- The company informed that the total amount of this dividend is approximately ₹4,089 crores.
- The record date for the dividend payment is set for Wednesday, December 27, 2023.
- The company plans to raise ₹3,400 crores through the issuance of debentures, each carrying a face value of ₹100,000.
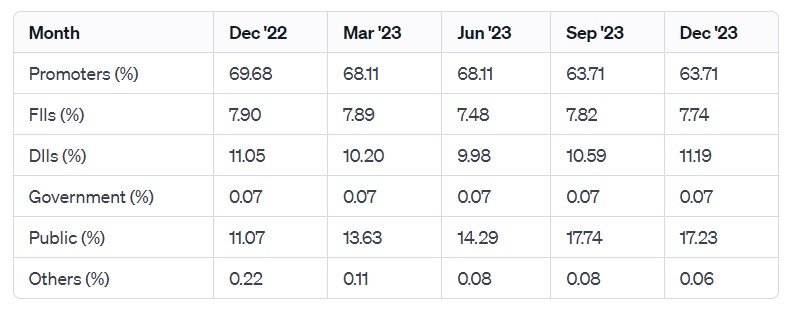
- Vedanta Resources, a major corporation, holds a substantial 63.7% stake in Vedanta Ltd.
- Despite a consolidated net loss of ₹915 crores in Q2 2023–24, the company showed resilience in its revenue from operations, registering a growth of 6.37%.
History of Vedanta Dividend
| Ex-Date |
Dividend Amount (₹) |
Dividend Type |
Record Date |
Instrument Type |
| 27 Dec 2023 |
11.00 |
INTERIM |
27 Dec 2023 |
Equity Share |
| 30 May 2023 |
18.50 |
INTERIM |
30 May 2023 |
Equity Share |
| 06 Apr 2023 |
20.50 |
INTERIM |
07 Apr 2023 |
Equity Share |
| 03 Feb 2023 |
12.50 |
INTERIM |
04 Feb 2023 |
Equity Share |
| 29 Nov 2022 |
17.50 |
INTERIM |
30 Nov 2022 |
Equity Share |
| 26 Jul 2022 |
19.50 |
INTERIM |
27 Jul 2022 |
Equity Share |
| 06 May 2022 |
31.50 |
INTERIM |
09 May 2022 |
Equity Share |
| 09 Mar 2022 |
13.00 |
INTERIM |
10 Mar 2022 |
Equity Share |
| 17 Dec 2021 |
13.50 |
INTERIM |
20 Dec 2021 |
Equity Share |
| 08 Sep 2021 |
18.50 |
INTERIM |
09 Sep 2021 |
Equity Share |
| 28 Oct 2020 |
9.50 |
INTERIM |
31 Oct 2020 |
Equity Share |
| 05 Mar 2020 |
3.90 |
INTERIM |
07 Mar 2020 |
Equity Share |
| 13 Mar 2019 |
1.85 |
INTERIM |
14 Mar 2019 |
Equity Share |
| 06 Nov 2018 |
17.00 |
INTERIM |
10 Nov 2018 |
Equity Share |
| 20 Mar 2018 |
21.20 |
INTERIM |
21 Mar 2018 |
Equity Share |
| 11 Apr 2017 |
17.70 |
INTERIM |
12 Apr 2017 |
Equity Share |
| 07 Nov 2016 |
1.75 |
INTERIM |
08 Nov 2016 |
Equity Share |
| 30 Oct 2015 |
3.50 |
INTERIM |
02 Nov 2015 |
Equity Share |
| 06 Jul 2015 |
2.35 |
FINAL |
– |
Equity Share |
| 03 Nov 2014 |
1.75 |
INTERIM |
05 Nov 2014 |
Equity Share |
| 04 Jul 2014 |
1.75 |
FINAL |
– |
Equity Share |
| 06 Nov 2013 |
1.50 |
INTERIM |
07 Nov 2013 |
Equity Share |
| 31 May 2013 |
0.10 |
FINAL |
– |
Equity Share |
| 08 Jun 2012 |
2.00 |
FINAL |
– |
Equity Share |
| 01 Feb 2012 |
2.00 |
INTERIM |
02 Feb 2012 |
Equity Share |
| 30 Jun 2011 |
3.50 |
FINAL |
– |
Equity Share |
| 02 Jul 2010 |
3.25 |
FINAL |
– |
Equity Share |
| 31 Jul 2009 |
2.25 |
FINAL |
– |
Equity Share |
| 11 Jul 2008 |
30.00 |
FINAL |
– |
Equity Share |
| 06 Feb 2008 |
15.00 |
INTERIM |
07 Feb 2008 |
Equity Share |
| 21 Sep 2007 |
25.00 |
FINAL |
– |
Equity Share |
| 19 Feb 2007 |
15.00 |
INTERIM |
20 Feb 2007 |
Equity Share |
| 04 Dec 2006 |
25.00 |
FINAL |
– |
Equity Share |
| 13 Mar 2006 |
15.00 |
INTERIM |
14 Mar 2006 |
Equity Share |
| 11 Jul 2005 |
20.00 |
FINAL |
– |
Equity Share |
| 06 Jan 2005 |
5.00 |
INTERIM |
07 Jan 2005 |
Equity Share |
| 28 Jun 2004 |
8.00 |
FINAL |
– |
Equity Share |
| 12 Feb 2004 |
2.00 |
INTERIM |
13 Feb 2004 |
Equity Share |
| 09 Sep 2003 |
2.50 |
FINAL |
– |
Equity Share |
| 20 Jun 2002 |
0.00 |
FINAL |
– |
Equity Share |
| 23 Jul 2001 |
0.00 |
FINAL |
– |
Equity Share |
About Vedanta Limited
- Vedanta Limited is a global powerhouse in natural resources.
- The company has a diverse portfolio of key interests, including aluminum, zinc-lead-silver, oil and gas, iron ore, steel, copper, power, ferroalloys, nickel, semiconductors, and glass.
- The company has strategic assets located across India, South Africa, Namibia, and Liberia.
- The company is committed to sustainable growth through investments in low-cost, diversified assets.
- The company prioritizes smarter processes, industry-leading efficiencies, and workforce empowerment.
- The company knows that it emphasizes corporate governance and responsible business practices.
- The company’s strategic decisions are backed by disciplined capital allocation and a robust cash flow framework.
- The company aligns activities with national goals, fostering progress while maintaining ethical and sustainable practices.
Management of Vedanta Limited
| Name |
Designation |
| Anil Agarwal |
Non Executive Chairman |
| Sunil Duggal |
WholeTime Director & CEO |
| Upendra Kumar Sinha |
Ind. Non-Executive Director |
| Dindayal Jalan |
Ind. Non-Executive Director |
| Navin Agarwal |
Executive Vice Chairman |
| Priya Agarwal |
Non Exe.Non Ind.Director |
| Akhilesh Joshi |
Ind. Non-Executive Director |
| Padmini Somani |
Ind. Non-Executive Director |
Registered Address
1st Floor, ‘C’ Wing,
Unit 103, Corporate Avenue,,Atul Projects,
Mumbai
Maharashtra
400093
Tel: 022-66434500
Fax: 022-66434530
Email: comp.sect@vedanta.co.in
Website: http://www.vedantalimited.com
Industry Type
Sector: Metals & Mining
Sub Sector: Diversified Metals
Classification: Largecap
Industry Name: Mining / Minerals / Metals
BSE Scrip Code: 500295
NSE Scrip code: VEDL
ISIN: INE205A01025
Pros & Cons of Vedanta Limited

Historical Performance
| Years |
Low |
High |
| 1 Year |
208.00 |
338.25 |
| 3 Years |
160.30 |
440.25 |
| 5 Years |
60.20 |
60.20 |
Investment Returns
| Period |
Returns |
| 1 year |
-19.20% |
| 2 Years |
-17.12% |
| 3 Years |
59.56% |
| 4 Years |
77.09% |
| 5 Years |
35.39% |
Technical Analysis of Vedanta Limited
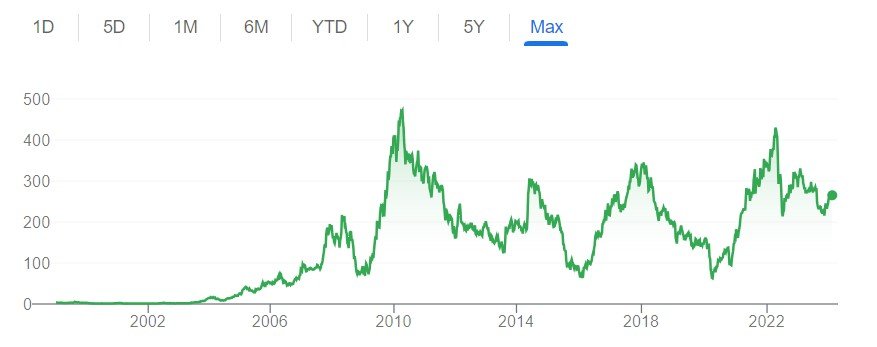
Chart
Fundamental Analysis of Vedanta Limited
| Metric |
Value |
| Market Cap |
₹ 97,986 Cr. |
| Current Price |
₹ 264 |
| High / Low |
₹ 338 / ₹ 208 |
| Stock P/E |
19.7 |
| Book Value |
₹ 85.0 |
| Dividend Yield |
38.5% |
| ROCE |
21.2% |
| ROE |
20.4% |
| Face Value |
₹ 1.00 |
| Pledged Percentage |
100.0% |
| Debt to Equity |
2.38 |
| Return on Equity |
20.4% |
| Debt |
₹ 75,064 Cr. |
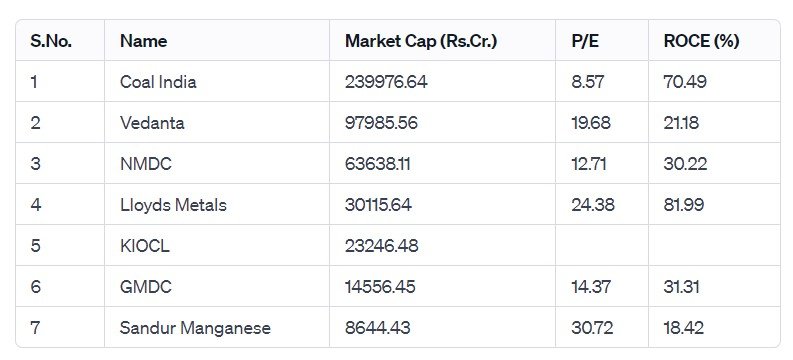
Peer Comparison
Shareholding of Vedanta Limited
Last 5 Years’ Sales (In Cr.)
| March 2019 |
March 2020 |
March 2021 |
March 2022 |
March 2023 |
| 92,048 |
84,447 |
88,021 |
132,732 |
147,308 |
Last 5 Years’ Net Profit (In Cr.)
| March 2019 |
March 2020 |
March 2021 |
March 2022 |
March 2023 |
| 9,698 |
-4,744 |
15,032 |
23,710 |
14,503 |
Last 5 Years’ Borrowings (In Cr.)
| March 2019 |
March 2020 |
March 2021 |
March 2022 |
March 2023 |
| 66,226 |
59,185 |
57,667 |
53,583 |
66,628 |
Compounded Sales Growth
| 10 Years: |
49% |
| 5 Years: |
10% |
| 3 Years: |
20% |
| TTM: |
-2% |
Compounded Profit Growth
| 10 Years: |
17% |
| 5 Years: |
4% |
| 3 Years: |
-10% |
| TTM: |
-65% |
CAGR
| 10 Years: |
3% |
| 5 Years: |
7% |
| 3 Years: |
17% |
| 1 Year: |
-18% |
Return on Equity
| 10 Years: |
14% |
| 5 Years: |
21% |
| 3 Years: |
24% |
| Last Year: |
20% |
Cash Flow (In Cr.)
| Particulars |
Mar 2019 |
Mar 2020 |
Mar 2021 |
Mar 2022 |
Mar 2023 |
| Operating Activities |
23,754 |
19,300 |
23,980 |
34,963 |
33,065 |
| Investing Activities |
-10,594 |
-5,925 |
-6,678 |
-2,243 |
-668 |
| Financing Activities |
-10,242 |
-15,547 |
-17,565 |
-28,903 |
-34,142 |
| Net Cash Flow |
2,918 |
-2,172 |
-263 |
3,817 |
-1,745 |
Revenue and Profit Trend
| Financial Year |
Revenue Growth |
Profit Growth |
| FY 2022-23 |
7.59% |
58.63% |
| FY 2021-22 |
69.01% |
64.19% |
| FY 2020-21 |
4.41% |
-256.02% |
| FY 2019-20 |
-7.21% |
-232.65% |
| FY 2018-19 |
-15.11% |
-30.06% |
Also Read –Smart Investment Moves From The Tata Share List: Identifying The Best Tata Group Share at ₹134 for Long-Term Gains!
Conclusion
This is a comprehensive guide to Vedanta Limited. The above-mentioned information and data are as of January 27, 2024. These figures and projections are based on our research, analysis, company fundamentals and history, experiences, and numerous technical analyses. In addition, we have discussed in depth the share’s prospects and growth potential. Hopefully, these details will be useful in your future investments. If you’re new to our website and want to stay up-to-date on the newest stock market news, join our Telegram group. If you have any further questions, please leave them in the comments section below. We will gladly address all of your inquiries. If you enjoyed this information, please share it with as many people as possible.
Disclaimer: Dear Readers,
- We are not authorized by SEBI (Securities and Exchange Board of India).
- The information provided above is for educational purposes and should not be considered financial advice or stock recommendations.
- Share price predictions are for reference purposes and are based on positive market indicators.
- The analysis does not account for uncertainties about future or current market conditions.
- The author, brokerage firm, or Finreturns.com are not liable for losses resulting from decisions.
- Finreturns.com advises consulting with certified experts before investment decisions.


Nice information keep it up
[…] Also Read –Vedanta Dividend History: Q3 Profit Warning Raises Questions Amidst Payout Records, Vedanta’s Divi… […]
[…] Also Read–Vedanta Dividend History: Q3 Profit Warning Raises Questions Amidst Payout Records, Vedanta’s Divi… […]